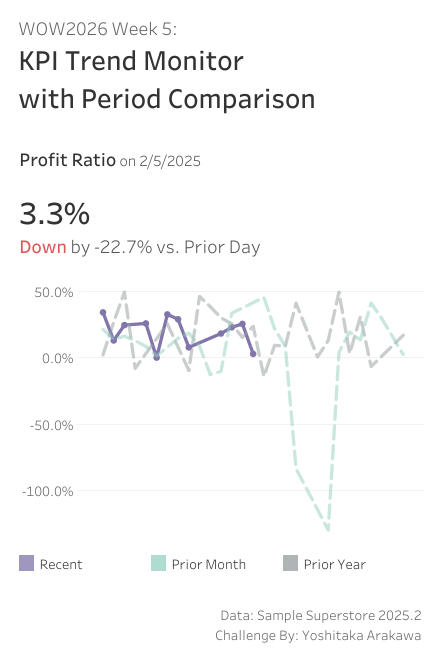
#WOW2026 | Week 5 | KPI Trend Monitor with Period Comparison
Introduction Thanks to tools like Tableau MCP, AI can now handle deep-dive data analysis for us. Ask it “why is this metric dropping?” and you’ll get a pretty solid answer. But before that step — noticing that something looks off in the first place — that’s still on us, looking at a dashboard. This week, […]
#WOW2026 | Week 5 | KPI Trend Monitor with Period Comparison Read More »