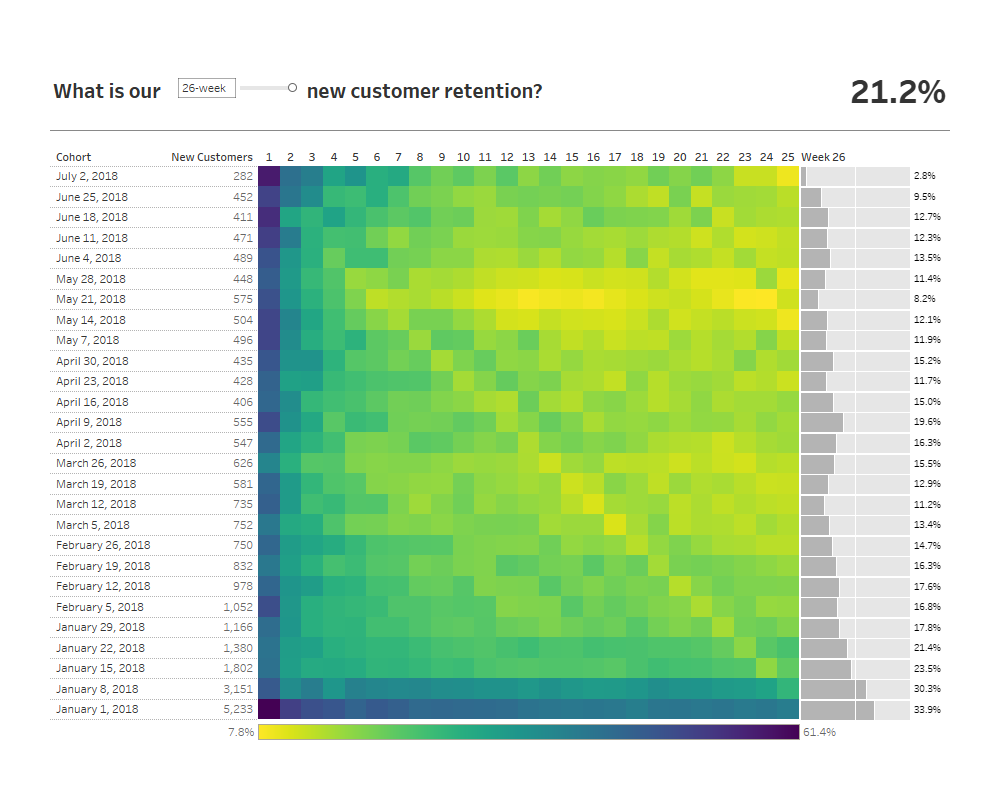
Workout Wednesday

Week 32: Can you create step area charts?

This week’s workout comes from a special guest, former Iron Viz champion Klaus Schulte! Klaus has come up with a great challenge for all of you; he and I (Curtis) will be your coaches this week. Thank you Klaus! Step line charts have been introduced with Tableau’s 2018.1 release and it’s really hard to remember […]

Week 32: Can you create step area charts? Read More »

Tableau, Workout Wednesday

2019 Week 31: When #WorkoutWednesday meets #PreppinData? Can you create a Hub and Spoke map?

This week, alongside WorkoutWednesday we have a new collaboration, which gives you a chance to try out another community project,  #PreppinData. PreppinData is a like workoutwednesday but with Tableau Prep Builder. Each week they give you a messy data set, some requirements and a finished data set, you then have to use Tableau Prep Builder

2019 Week 31: When #WorkoutWednesday meets #PreppinData? Can you create a Hub and Spoke map? Read More »

Tableau, Workout Wednesday

Week 30: Creating a Navigating KPI Block

If your schedule is anything like mine, then you’re probably enjoying the summer months – using vacation time, nicer weather, summer holidays, and a generally more relaxed schedule.  To help keep that vibe going, this week I’m challenging you to a very straightforward build.  This is an extremely simplified version of something I recently built

Week 30: Creating a Navigating KPI Block Read More »

Tableau, Workout Wednesday

2019 Week 29: Which months do we see a higher number of orders?

Last week we were putting together a deck for an executive team and we wanted to show the seasonality of data while still showing the overall average. In our time crunch we came up with our challenge for this week!p Challenge – Intermediate Click image to view on Tableau Public Requirements – Intermediate Format: 900px

2019 Week 29: Which months do we see a higher number of orders? Read More »

Tableau, Workout Wednesday

2019 Week 24: Can you build a side-by-side bar chart?

This week you need to build this side-by-side bar chart. There are a couple of tricks but you should be able to do this in under 30 minutes (for real!). There are at least 4 ways to solve this problem. There are also two problems an intermediate and an advanced. Challenge – Intermediate Click image

2019 Week 24: Can you build a side-by-side bar chart? Read More »

Tableau, Workout Wednesday

2019 Week 23: Can you get creative with bar charts?

What do you do when you have limited real estate? What do you do when vanilla Tableau just isn’t going to cut it? This week’s workout should be a quick exercise designed to give you a few strategies that save on real estate, enable simple interactivity, and promote consistent design throughout your dashboards. This one

2019 Week 23: Can you get creative with bar charts? Read More »

Tableau, Workout Wednesday