Tableau

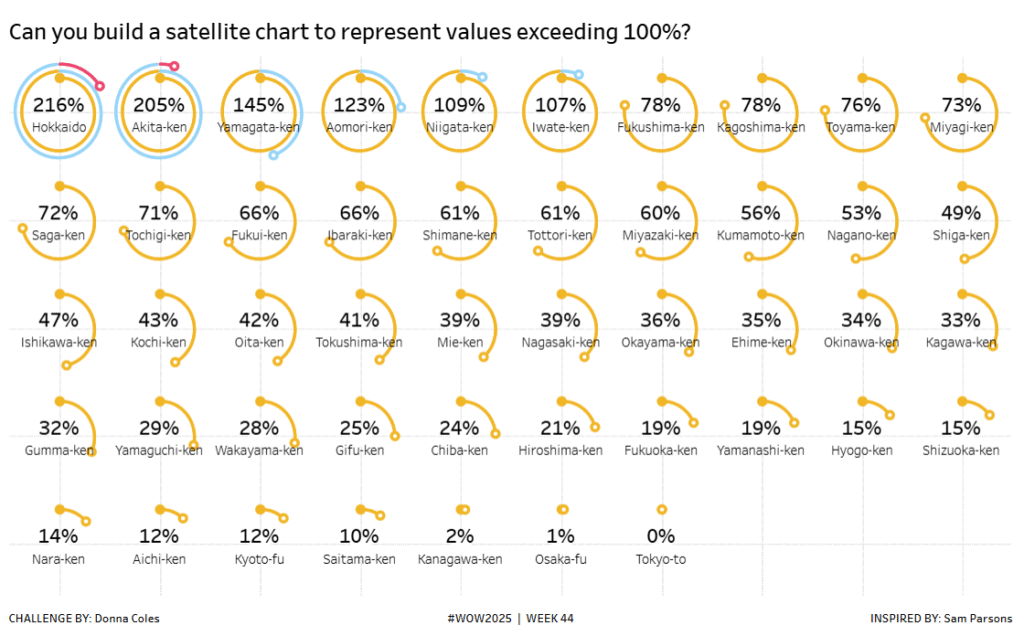
#WOW2025 | Week 44 | Can you build a satellite chart to represent values exceeding 100%?

Introduction Some time ago the brilliant Sam Parsons, developed a “Satellite” or “Spiral” Chart as an alternative way to visualise a donut that exceeded 100%.https://public.tableau.com/app/profile/sparsonsdataviz/viz/SpiralingSatelliteCharts/SpiralingSatelliteCharts. As with many things Sam comes up with, I always want to see if I can build it, and once again it’s a great excuse for a #WOW challenge. Back […]

#WOW2025 | Week 44 | Can you build a satellite chart to represent values exceeding 100%? Read More »

Tableau, Workout Wednesday
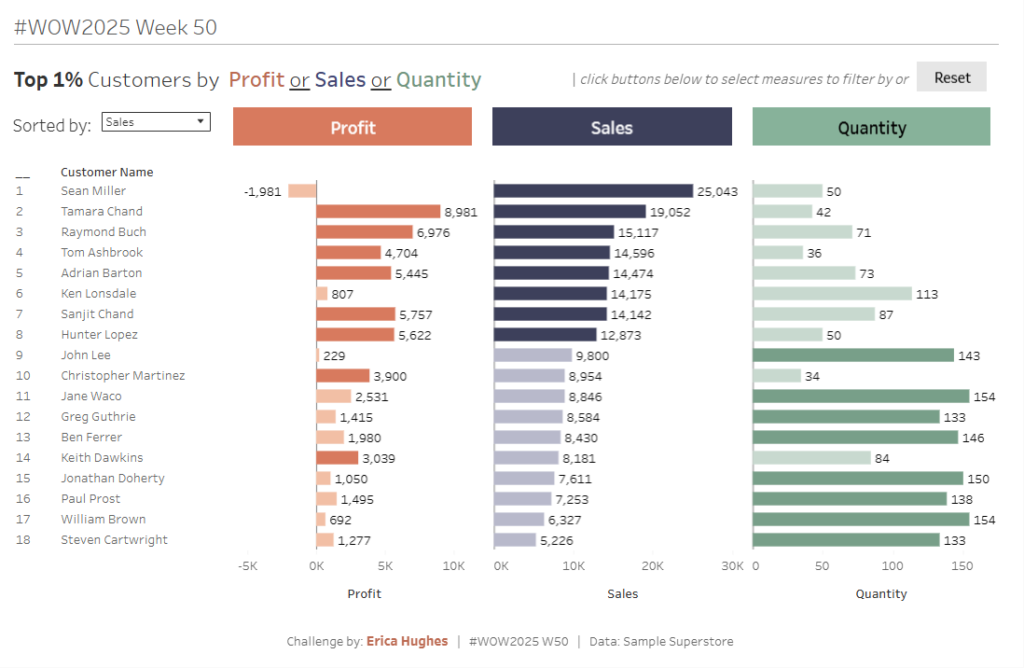
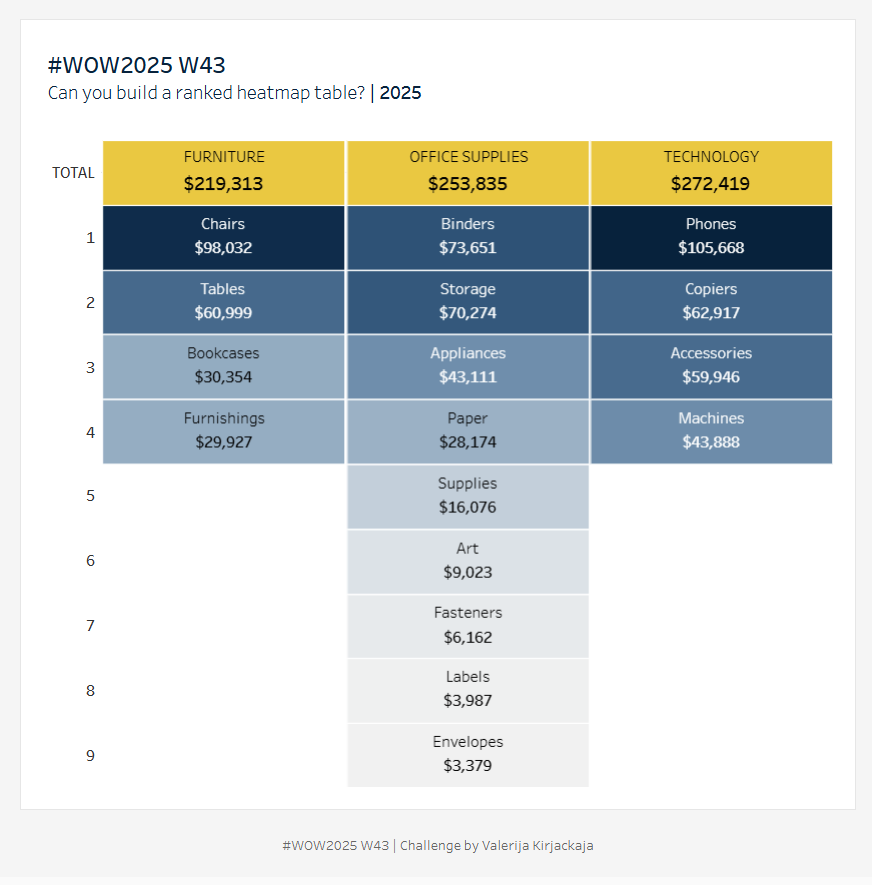
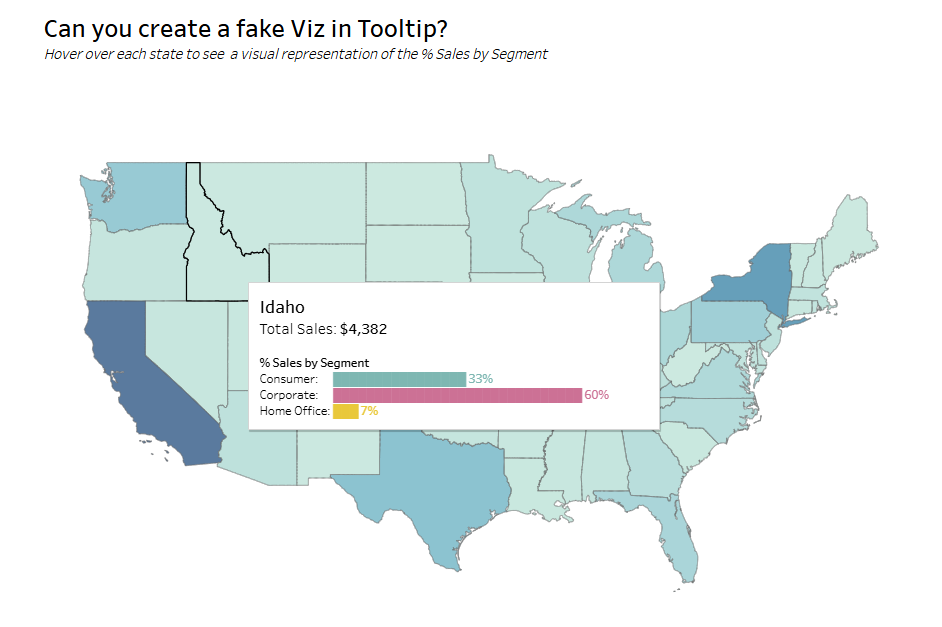
#WOW2025 | Week 43 | Can you build a ranked heatmap tile?

Introduction A huge thank you to Valerija Kirjackaja for her continued support as guest coach. This week I had an idea that I didn’t have time to test and implement, due to other life priorities, so I feel very grateful to be able to lean on the people around me for support. This feels like

#WOW2025 | Week 43 | Can you build a ranked heatmap tile? Read More »

community, Tableau, Workout Wednesday

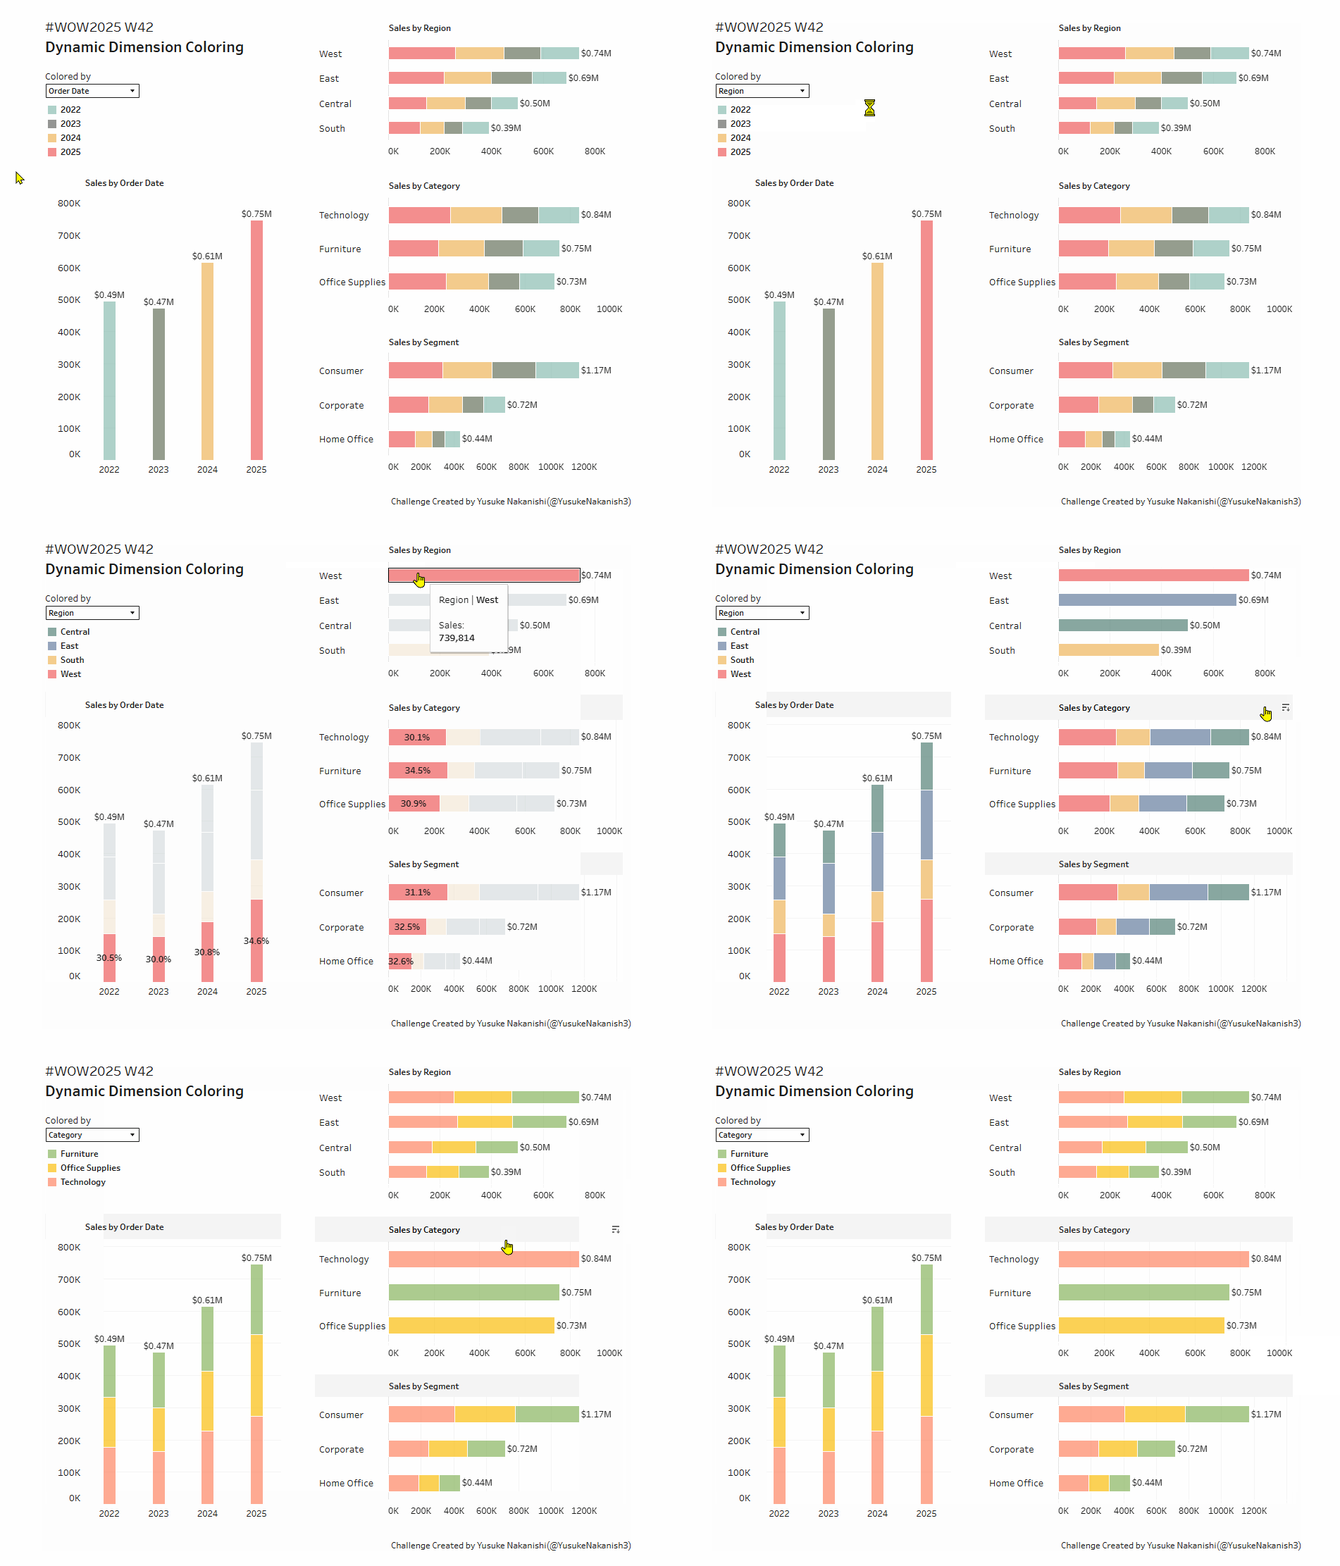
#WOW2025 | Week 42 | Dynamic Dimension Coloring

Introduction I recently received a business request with the following requirements: The user wants to easily change the dimension that colors the charts on a dashboard. The list of dimensions might be added or removed in the future, so the solution needs to be simple and easy to maintain. This week’s challenge is inspired by

#WOW2025 | Week 42 | Dynamic Dimension Coloring Read More »

Tableau, Workout Wednesday
#WOW2025 | Week 41 | Let’s Make a Tableau Pulse-inspired Dashboard!

Introduction In this challenge, you’ll recreate a Tableau Pulse–inspired dashboard from scratch. One of the key features of Tableau Pulse is to automatically detect trends and changes in your data, displaying an “Expected Range” for each metric to help users instantly grasp performance at a glance. Your task is to reproduce this concept using Tableau’s

#WOW2025 | Week 41 | Let’s Make a Tableau Pulse-inspired Dashboard! Read More »

Tableau, Workout Wednesday
#WOW2025 | Week 40 | Can you create this Zoom and Reset Scatter Plot?

Introduction I had a thought last week about using the parameter driven axis ranges and whether they could be reset to the minimum and maximum. Turns out they can be, and hence this challenge.  Click to open in Tableau Public Requirements 1 sheet You’ll need: 4 parameters 4 LODs 1 colour calc (reference lines are

#WOW2025 | Week 40 | Can you create this Zoom and Reset Scatter Plot? Read More »

Tableau, Workout Wednesday
#WOW2025 | Week 37 | Let’s Practice Table Calcs!

Introduction This week we’re going easier than typical. We’re going back to the basics. We’re going to practice our Table calculations in a simple easy dashboard. If you wanna take it up a notch, feel free but this week is keeping it simple. So here go! Let’s practice Table Calcs This week’s challenges highlights data

#WOW2025 | Week 37 | Let’s Practice Table Calcs! Read More »

Tableau, Uncategorized

#WOW2025 | Week 36 | Can You Build a Color-Coded Filter?

Introduction This week’s challenge is brought to you by yet another Guest Coach and active member of the Tableau and Workout Wednesday communities. Presenting, Giulio D’Errico! Giulio proposed this challenge to me several weeks ago and we have worked together to build out his idea. This challenge applies some great fundamental skills, and then has

#WOW2025 | Week 36 | Can You Build a Color-Coded Filter? Read More »

community, Tableau, Workout Wednesday

#WOW2025 | Week 35 | Can You Visualize Yearly Rank Changes in Sub-Category Sales?

Introduction I’ve recently been running several hands-on Tableau workshops for beginner- to intermediate-level users across different prefectures. In one of those sessions, a participant asked how to visualize both ranking changes and differences in sales at the same time. This week’s challenge was inspired by that question. It might be a bit tricky, but I

#WOW2025 | Week 35 | Can You Visualize Yearly Rank Changes in Sub-Category Sales? Read More »

Tableau, Workout Wednesday