#WOW2023 | Week 21 | Profit vs Target (with Tolerance)
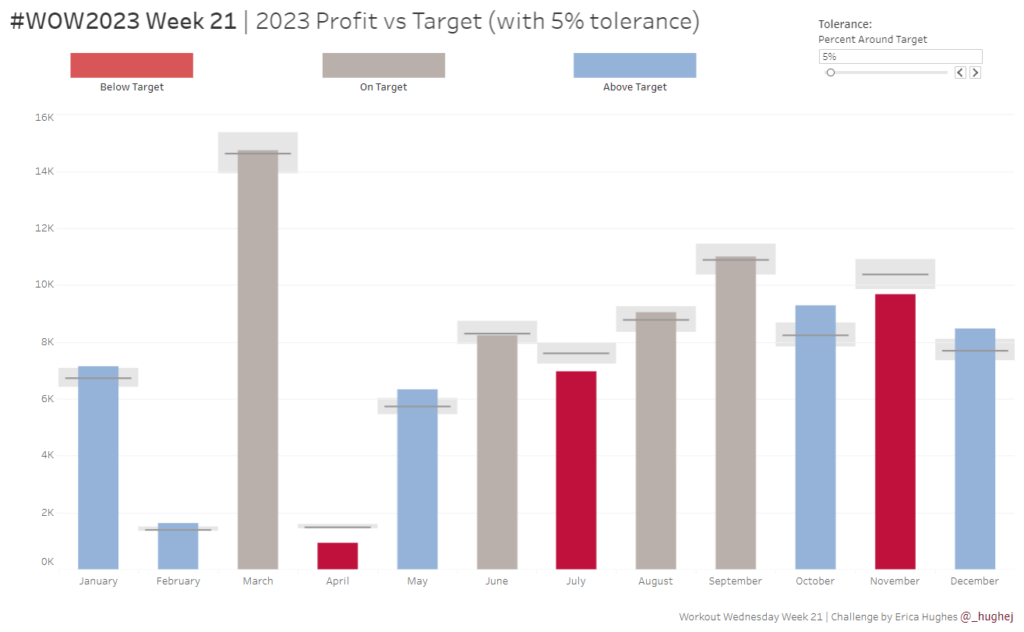
Introduction This week’s challenge is a slight twist on the classic Measure (bar) vs Target (gantt) chart. The key difference here is that we want to allow the user to select a ‘tolerance’ around the specific Target value. We only want to highlight months where profit was Above or Below the permited tolerance. Click to […]
#WOW2023 | Week 21 | Profit vs Target (with Tolerance) Read More »
Tableau, Workout Wednesday