2024 Week 28 | Sigma: Are you ready for vacation?
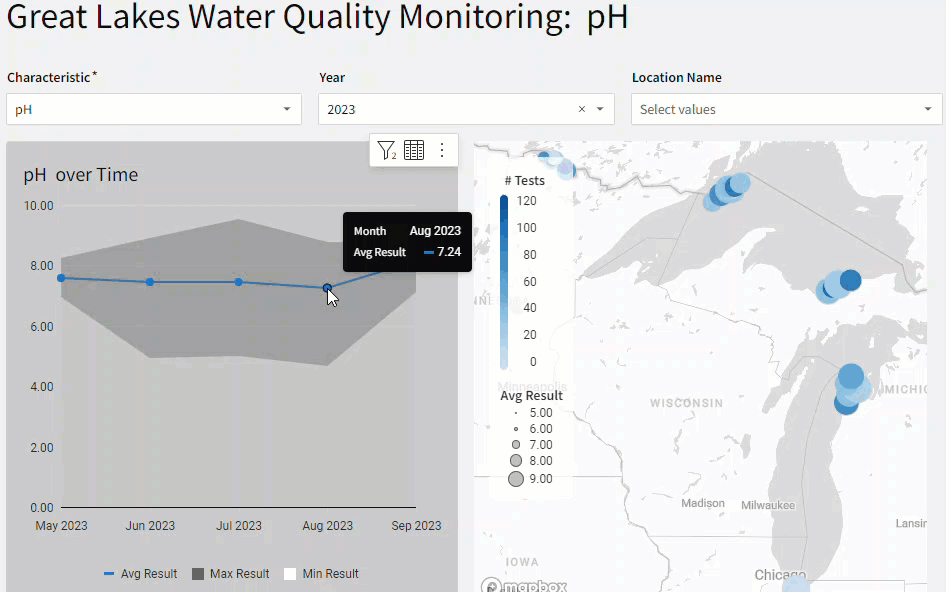
Introduction Welcome to Week Twenty-Eight! Now that we are firmly in Summer Mode, let’s plan a lake vacation! This week, we’re going to evaluate water quality monitoring data in the Great Lakes. The dataset we’re using comes from Data.Gov. This dataset has many different characteristics measured in one long table. Don’t worry. I’ve already created a Sigma […]
2024 Week 28 | Sigma: Are you ready for vacation? Read More »
Sigma, Workout Wednesday