
Power BI

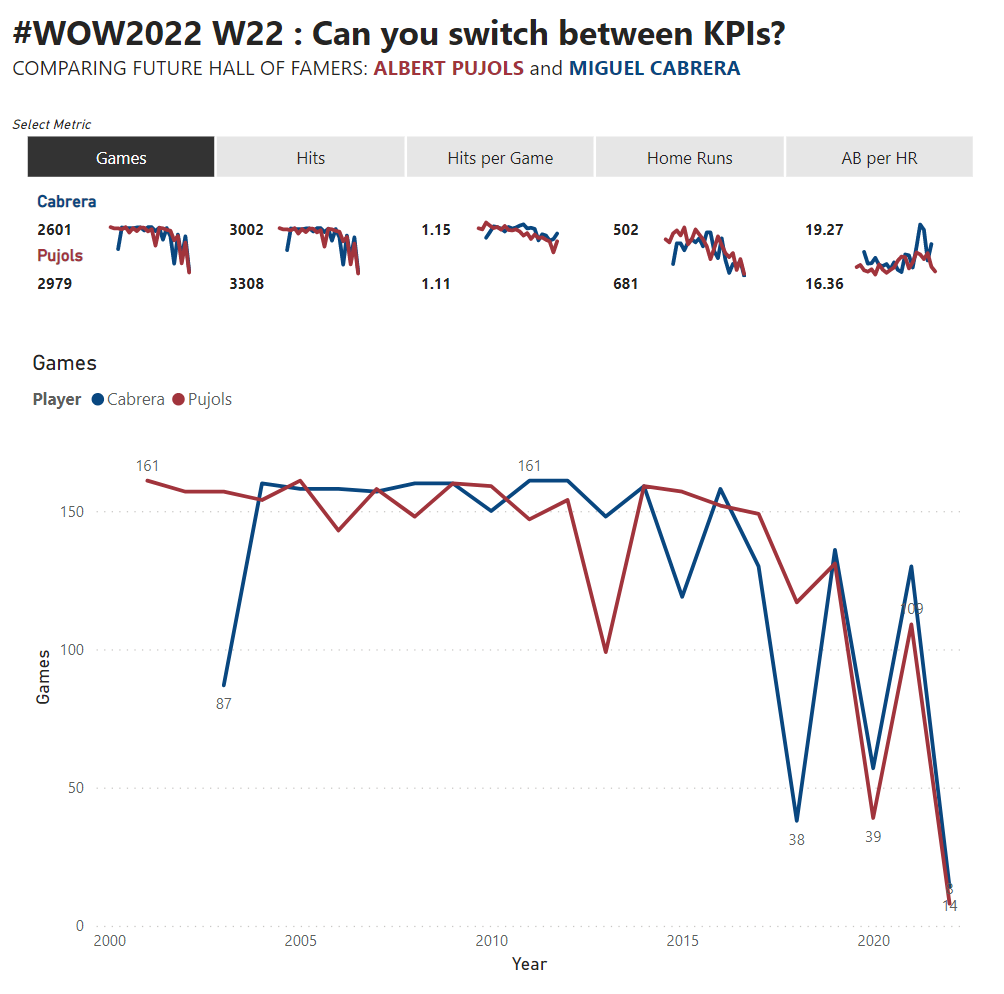
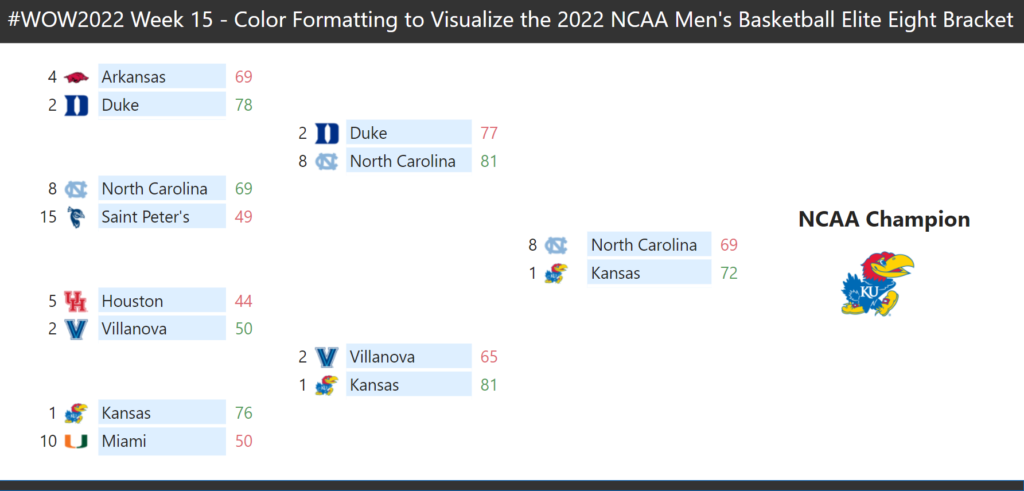
2022 Week 15 | Power BI: March Madness

Introduction For basketball fans in the United States, March is a special time.  It is when 64 of the best college basketball teams match up in a single elimination tournament to see who is the NCAA Men’s Basketball champion.  The early rounds of the tournament provide long days of basketball games across several TV stations.  […]

2022 Week 15 | Power BI: March Madness Read More »

Power BI, Workout Wednesday
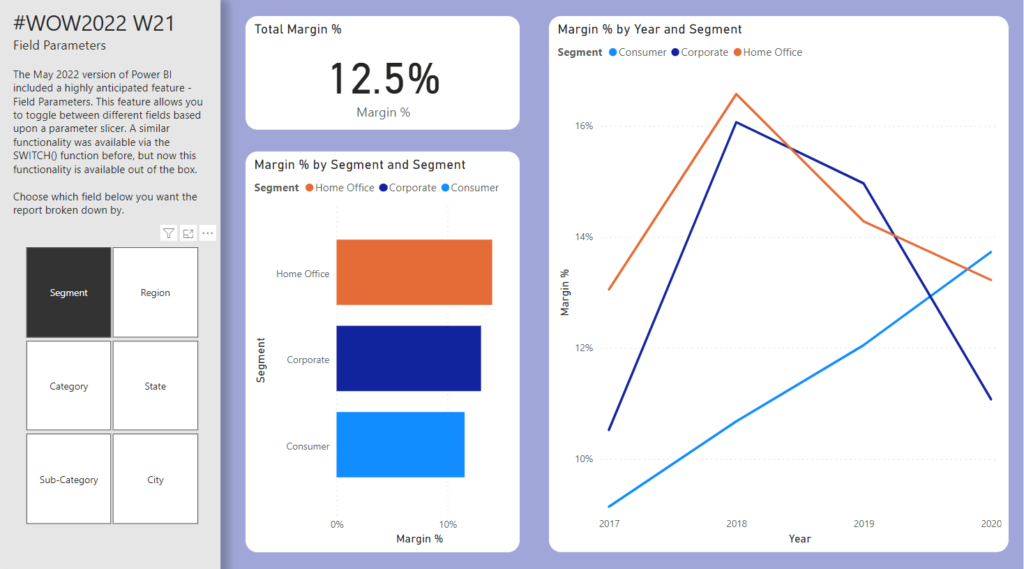
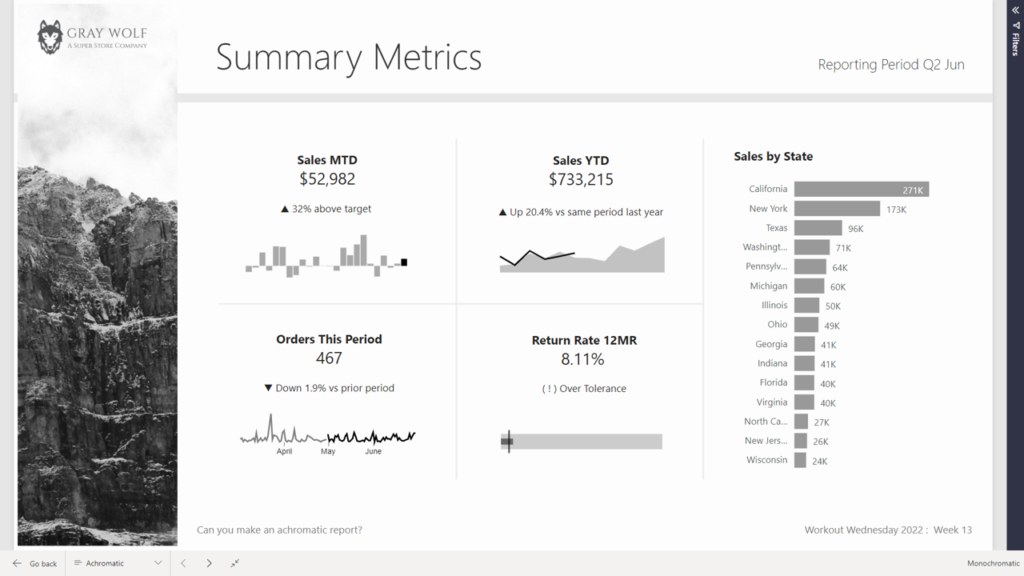
2022 Week 14 | Power BI: Create an achromatic report

Introduction April is colour month for Power BI Workout Wednesday 2022. First up we are going to try our hand at creating reports WITHOUT hue. Using a file from a previous challenge, can you create an achromatic report that uses contrast and lightness effectively? There will be some creative freedom involved in this challenge, no

2022 Week 14 | Power BI: Create an achromatic report Read More »

Power BI, Workout Wednesday
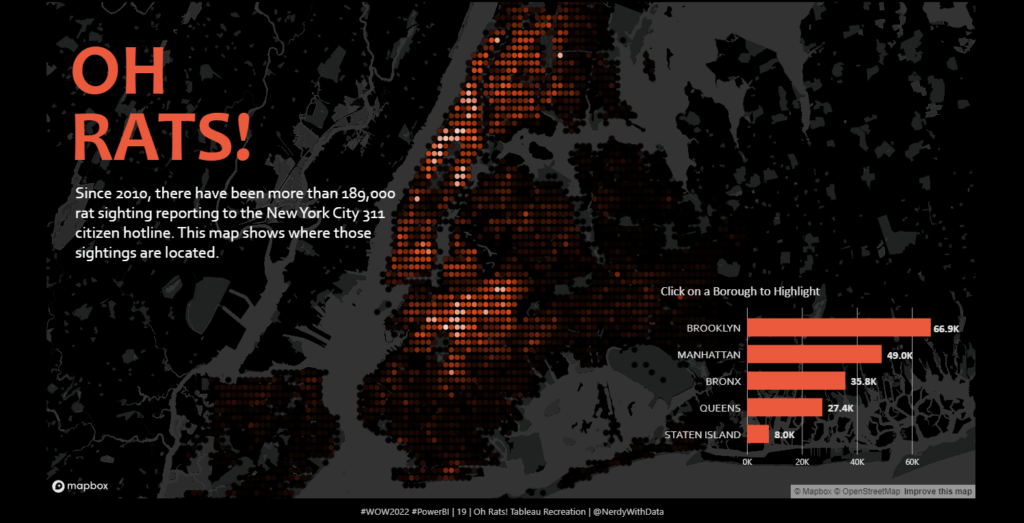
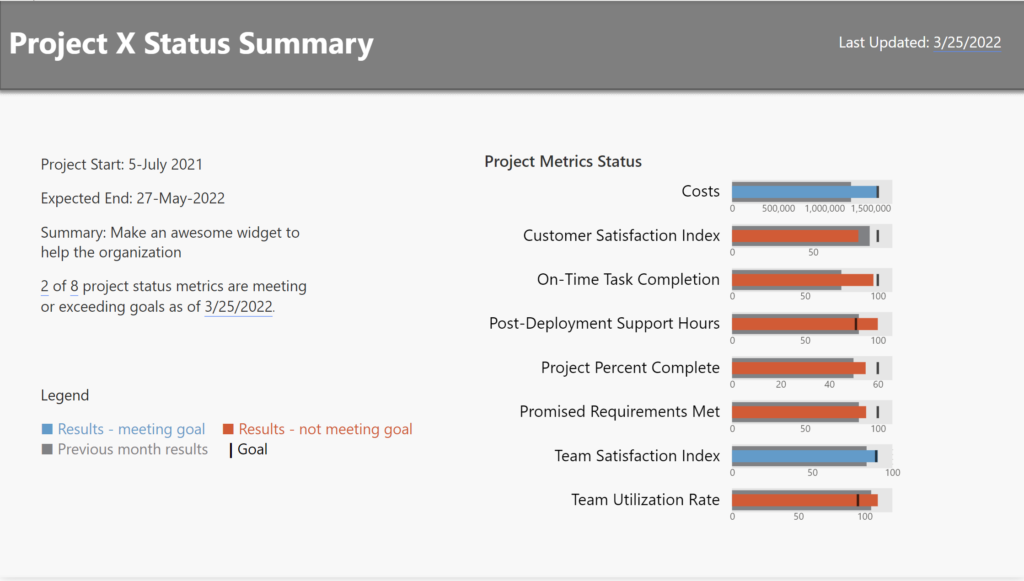
Power BI Report containing Demeb bullet charts

2022 Week 13 | Power BI: Build a Bullet Chart with Deneb

Introduction For this last week of March, we are continuing our project management theme.  The challenge this week is to use Deneb to build bullet charts using the provided data. Bullet charts were created by Stephen Few to offer an alternative to clunky gauges. Bullet charts are used to compare a featured measure to one or

2022 Week 13 | Power BI: Build a Bullet Chart with Deneb Read More »

Power BI, Workout Wednesday
2022 Week 12 | Power BI: Build a Slicer Panel

Introduction Welcome back to Workout Wednesday – we’re glad you’re here! This week, we’re continuing on with our project management theme. We’re tracking project progress using data generated from Microsoft Planner. Using Power BI with Planner (as opposed to using the inbuilt charts) enables us to both customize visuals and to view more than one plan at

2022 Week 12 | Power BI: Build a Slicer Panel Read More »

Power BI, Workout Wednesday
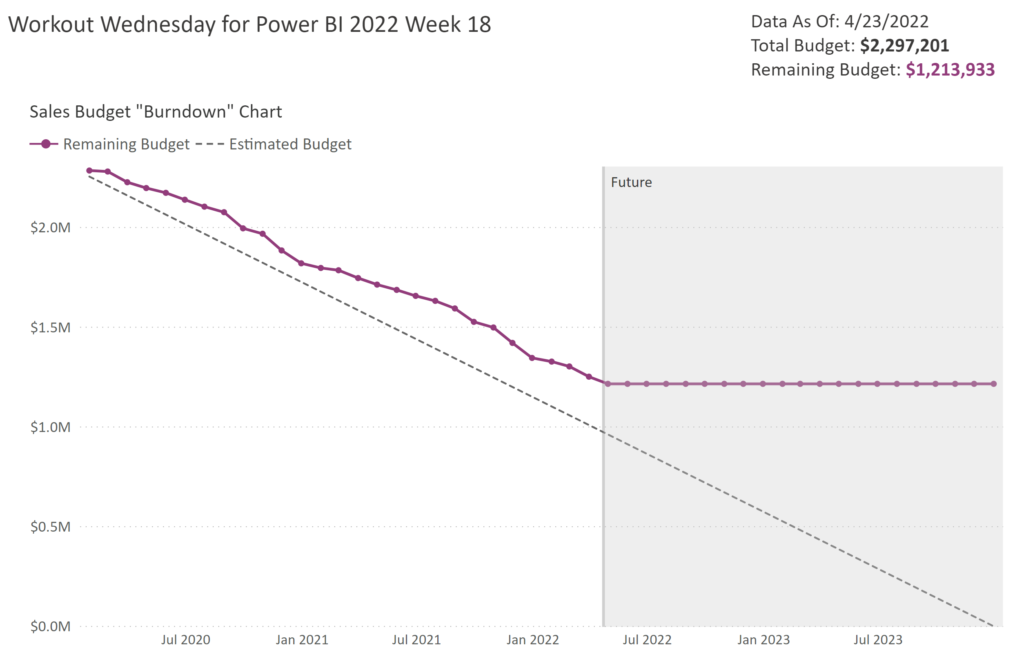
2022 Week 11 | Power BI: Project Budget Tracker

Introduction Your challenge this week is to create a Project Budget Tracker leveraging the IT Spend Analysis example dataset available to everyone in Power BI Service.  We decided to keep the project management theme going this week with this take on tracking how your project is following the budget.  If you did not do last week’s challenge, I

2022 Week 11 | Power BI: Project Budget Tracker Read More »

Power BI, Workout Wednesday
2022 Week 10 | Power BI: Risk Matrix

Introduction Your challenge this week is to create a Risk Matrix with some supporting visuals.  We decided to keep the project management theme going this week.  If you did not do last week’s challenge, I highly recommend you checkout Kerry’s Gantt Chart challenge, here.   For this challenge, I looked at a lot of possible ways to create a

2022 Week 10 | Power BI: Risk Matrix Read More »

Power BI, Workout Wednesday
2022 Week 08 | Power BI: Can you make a Gantt Chart?

Introduction This week we are creating Gantt Charts in Power BI. It is not required to do all 4 variations, choose one of the options that interests you the most. Each option increases in time and/or experience level. Requirements QUICK MODE Import data Import the Microsoft Gantt Chart from AppSource Place Project Category in the

2022 Week 08 | Power BI: Can you make a Gantt Chart? Read More »

Power BI, Workout Wednesday
Power BI Parallel Sets

2022 Week 07 | Power BI: Parallel Sets

Introduction Welcome to week 7 of Workout Wednesday for Power BI 2022. We are again using the Data Visualization Society‘s annual State of the Industry survey results.  This week we are looking at how we can visualize parallel sets. Although this may not be a visual that we use often, it can be very useful for multivariate analysis.

2022 Week 07 | Power BI: Parallel Sets Read More »

Power BI, Workout Wednesday
2022 Week 06 | Power BI: Key Influencers

Introduction Welcome back to Power BI #WorkoutWednesday – we’re now in week 6! If you’re joining us for the first time, welcome! There are no dependencies on previous weeks – you’re welcome to jump right in with this week’s challenge, where we’ll use AI in Power BI to get an understanding of key influencers of

2022 Week 06 | Power BI: Key Influencers Read More »

Power BI, Workout Wednesday
Week 05 2022 Challenge

2022 Week 05 | Power BI: Can you make a Nested Chart with Charticulator?

Introduction This week we are familiarising ourselves with Charticulator and Nested Charts. This graph was inspired by Gus Wezerek and Sara Chodosh’s chart for NYT Opinion. Requirements Download the data and remove all columns excepting the Date field, New Cases Smoothed Field and Location (save as csv) Create a second csv with only Location =

2022 Week 05 | Power BI: Can you make a Nested Chart with Charticulator? Read More »

Power BI, Workout Wednesday