
Author name: Robbin Vernooij

2026 Week 38 | Power BI: SVG Donuts

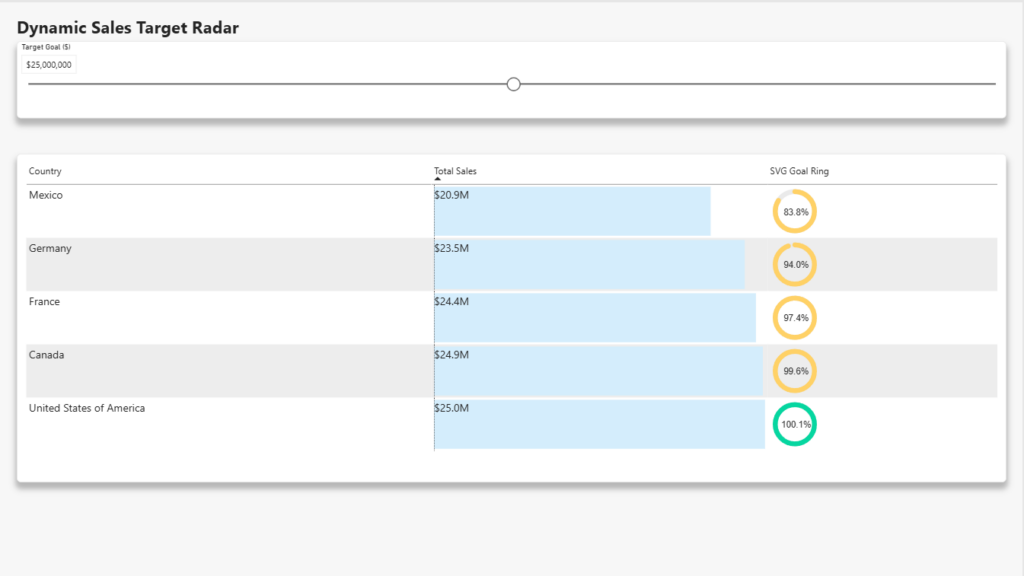
Introduction For this week’s Workout Wednesday challenge, we’re diving into a creative visual design trick that Fotiana Yan thinks you’re going to love trying out! (and I agree!) Picture this: you have a stakeholder who wants sleek, colour-shifting progress rings for every country where they sell products to track progress toward a target, complete with […]

2026 Week 38 | Power BI: SVG Donuts Read More »

Power BI, Workout Wednesday
2026 Week 32 | Power BI: Pareto Chart with Colored Backgrounds

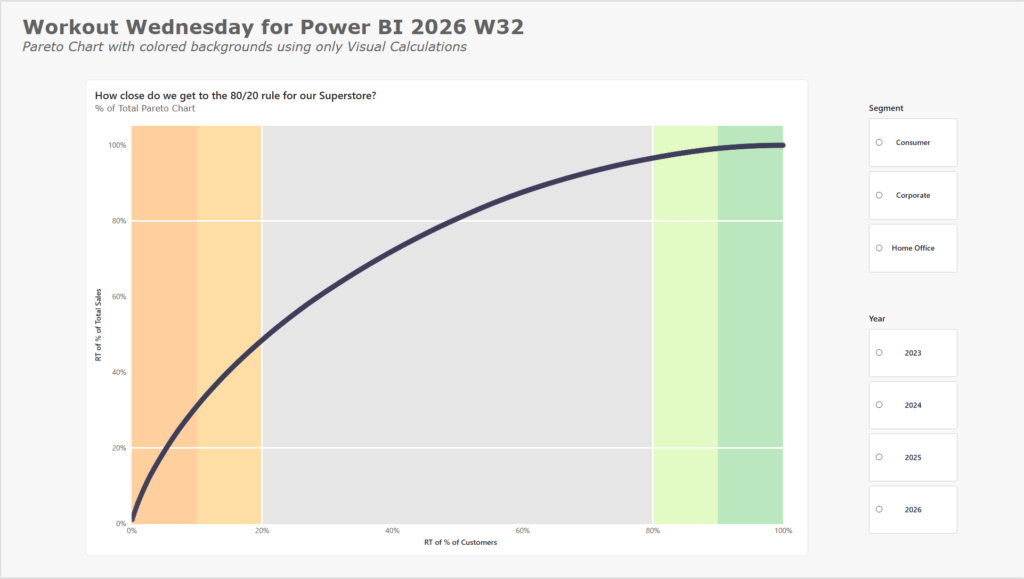
Introduction This week we are exploring the Pareto Principle; the 80:20 rule, which states that roughly 80% of our consequences from from 20% of causes.  Inspired by the #WorkoutWednesday by Lisa Hitch, we are going to see if 20% of our Superstore customers make up 80% of our Total Sales. To visually aid our users,

2026 Week 32 | Power BI: Pareto Chart with Colored Backgrounds Read More »

Power BI, Workout Wednesday