
Introduction
This week we are exploring the Pareto Principle; the 80:20 rule, which states that roughly 80% of our consequences from from 20% of causes.
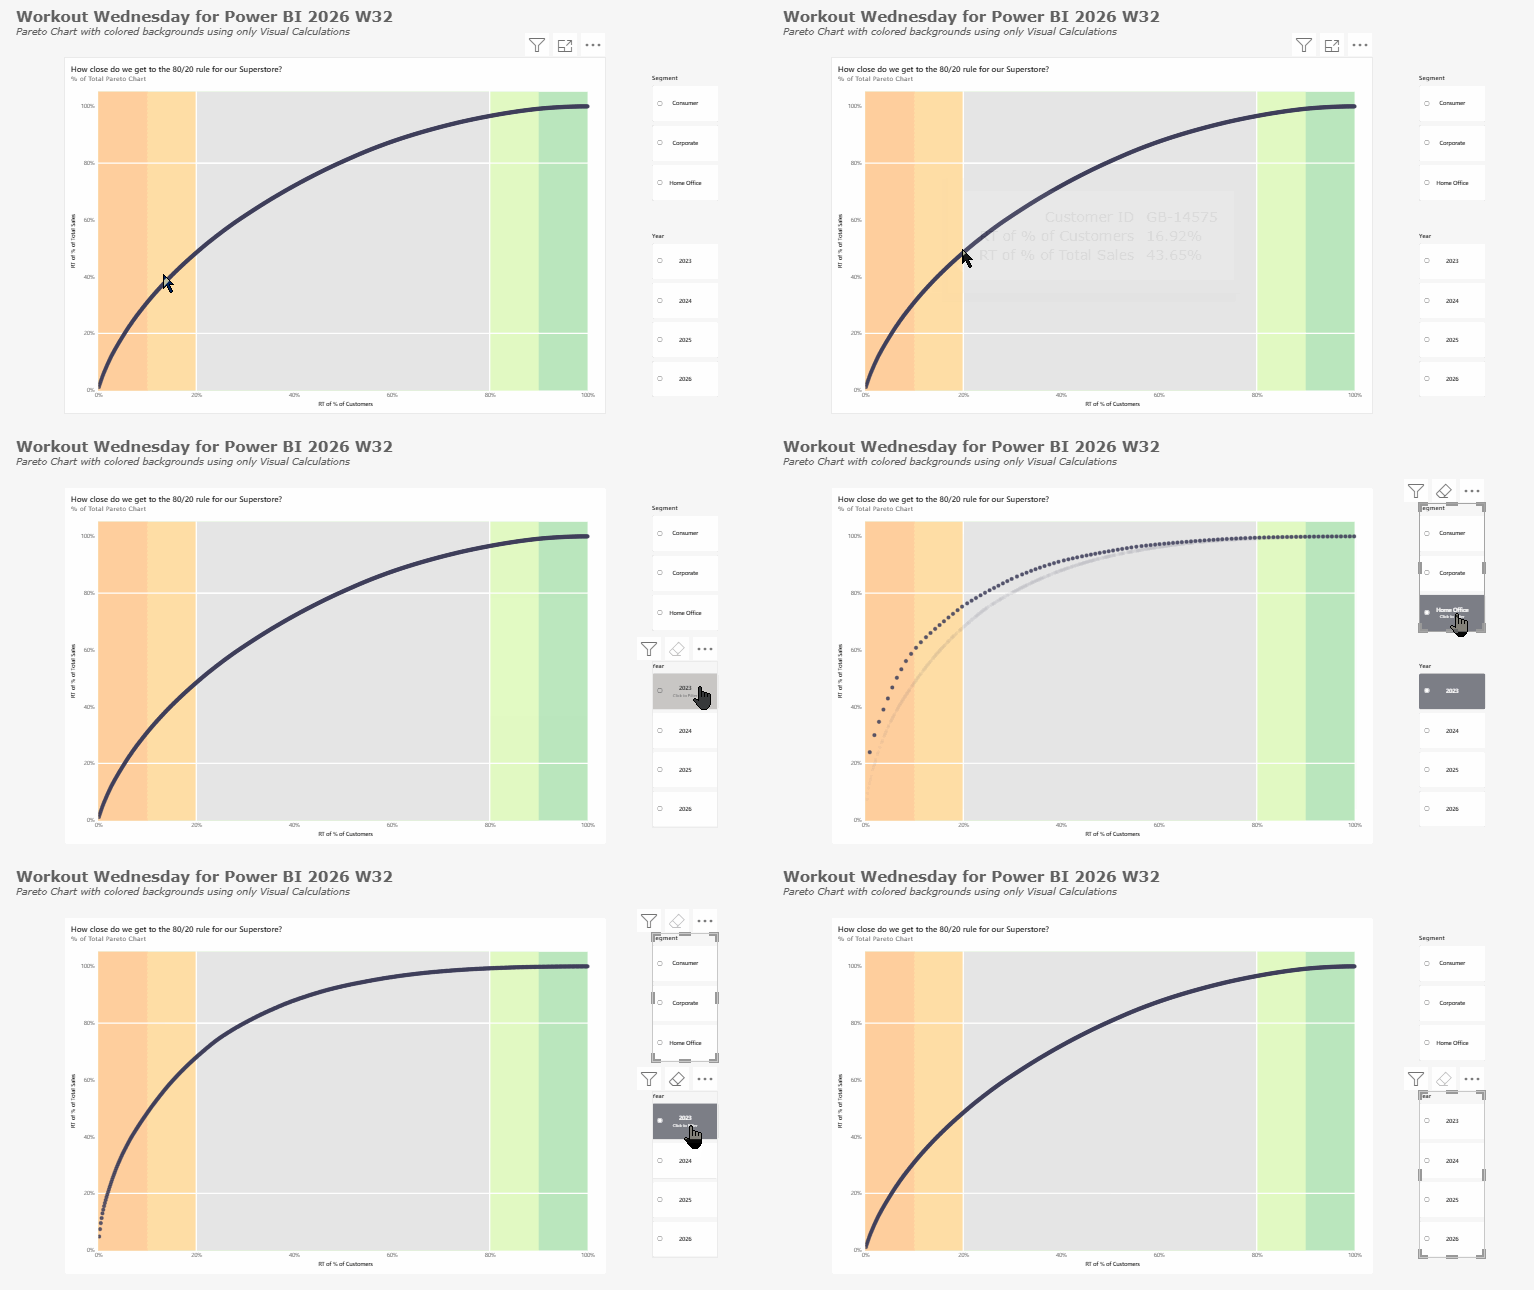
Inspired by the #WorkoutWednesday by Lisa Hitch, we are going to see if 20% of our Superstore customers make up 80% of our Total Sales. To visually aid our users, we make sure that we shade important thresholds of the chart.
This particular chart requires a range of ad-hoc calculations, perfect for the Visual Calculation feature!
A solution video and file can be found ⬇️
Please note, Visual Calculations are not supported in Publish to Web yet, therefor an gif is provided below instead.
Dataset
Data for this challenge can be obtained from GitHub.
https://github.com/Imba456/Workout-Wednesday-for-Power-BI/blob/main/datasets/Superstore%20Orders%202026.csv
Requirements
- Download the CSV file and connect the data into Power BI.
- Build our a scatter plot showing one mark for each unique customer and their sum of sales.
- Plot the Running Total of % Unique Customers vs. the Running Total of % of Total Sales.
- Both Axis are fixed between 0 to 100.5%.
- Add 4 white lines, 20% and 80% for both axis.
- Add background shading to divide the x-axis into five colored sections. Color scheme:
- #ffcf9e
- #ffdea6
- #e6e6e6
- #e2fac3
- #bbe7be
- Add two button slicer visuals to allow slicing by Segment and Year of Order Date. If the user hovers of a slicer, it should depict “Click to Filter” under the value.
- If you are new to Visual Calculations, check out the learn.microsoft article for reference.
- For this particular chart we are after multiple layers of calculations; to help guide you try to break it up into multiple steps:
- For sales create the running totals of each measure first, before adding a second visual calcuations to calculation the % of total.
- For the unique customer count, we first want to calculate the % of total (every customer would have an equal % of the whole list of customers) before adding another visual calculations that calculates the running total which can be sorted by their sales.
Share
After you finish your workout, share on social media using the hashtags #WOW2026 and #PowerBI.
On Bluesky, tag @mmarie.bsky.social, @shan-gsd.bsky.social, and @merrykerry.bsky.social.
On LinkedIn, tag @RobbinVernooij