Introduction
This week we have a challenge set by a fellow Data School Consultant, Oscar Kriebel. Yes you read that correctly another Kriebel in the Tableau World.
Oscar kindly volunteered to submit a challenge for this week. Whilst I don’t agree with seeing so many Pie Charts, the techniques are interesting! Have fun!
Requirements
- Dashboard size: 1200 x 900
- Font: Verdana
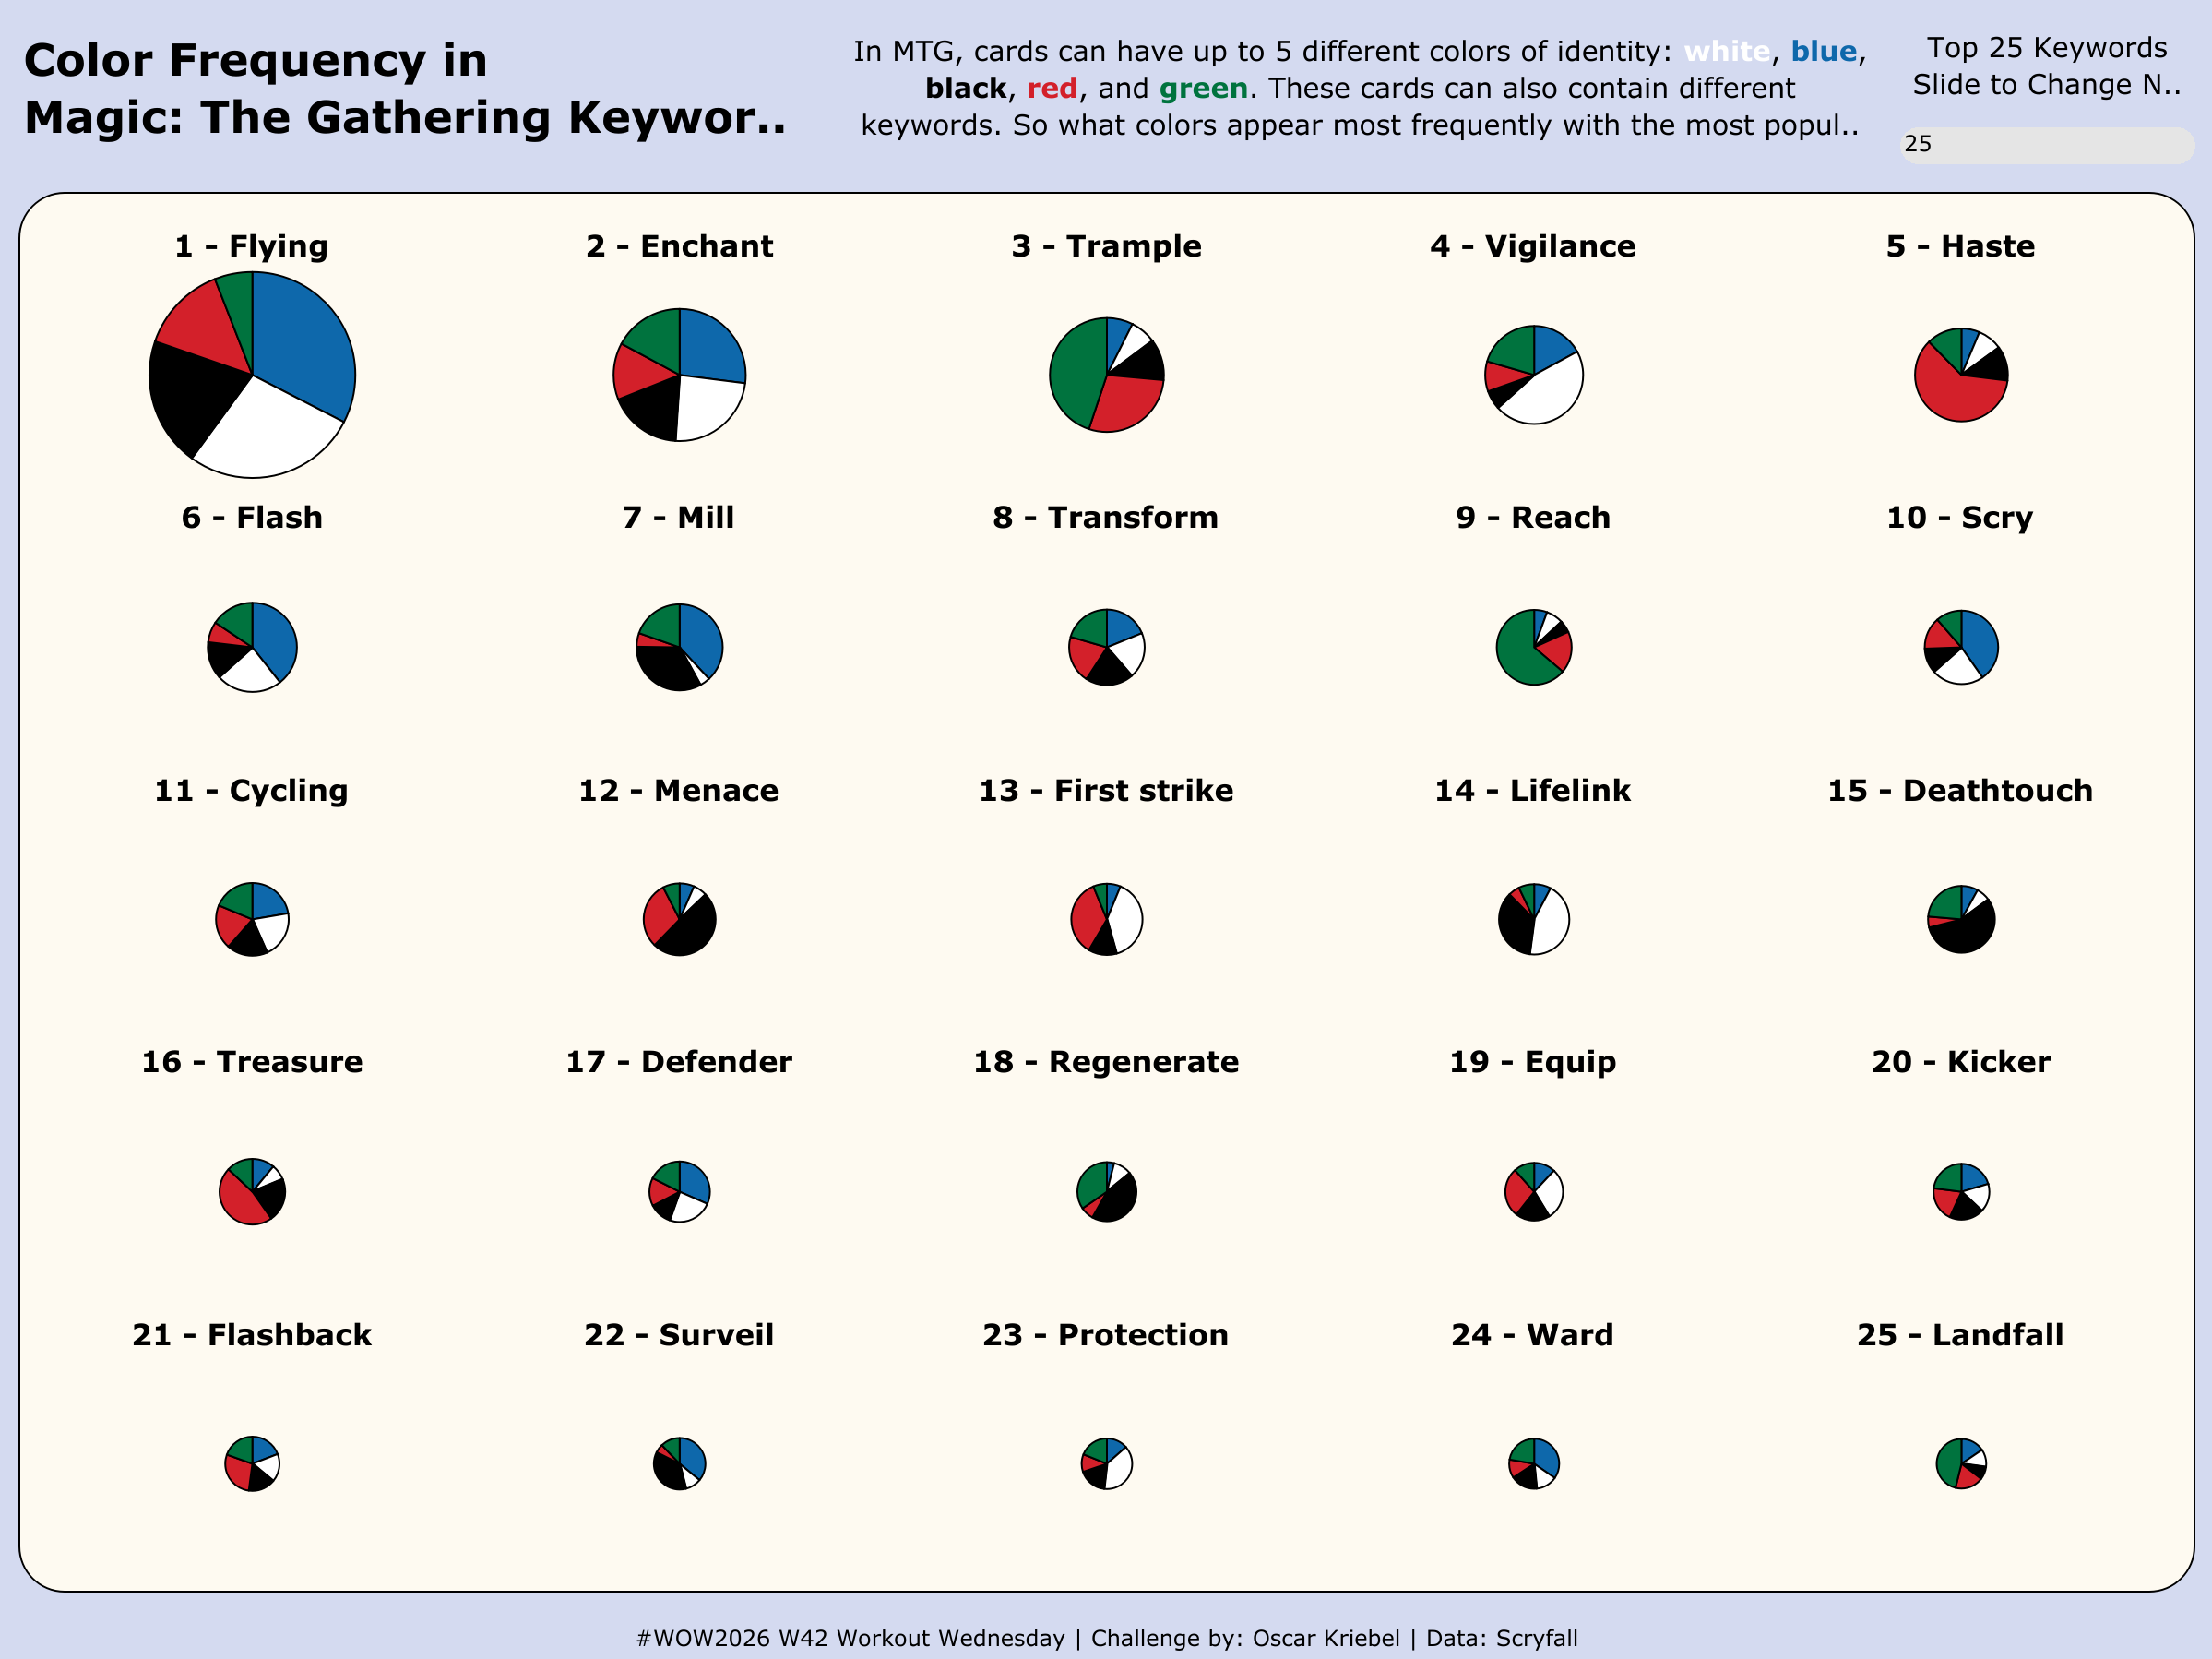
- One worksheet: Trellis/Small Multiple Pie Chart
- Trellis Pie Chart:
- Split by Keyword
- Pie chart:
- Split by Color Identity
- Angle by Number of Cards with that Color Identity
- Sized on the total number of unique cards with a keyword
- Title based on the Keyword
- Include ranking of the total number of unique cards
- Parameter to include Top N Keywords
- 1 to 25 for N
- Filter to Top N Keywords based on parameter
- Trellis should be sized on the number of Keywords allowed automatically
- Colors used in dashboard:
- Background color: #d4daf0
- Chart background: #fefaf1
- White: #ffffff
- Black: #000000
- Green: #00733e
- Blue: #0e68ab
- Red: #d3202a
Dataset
Available from here.
Attribute
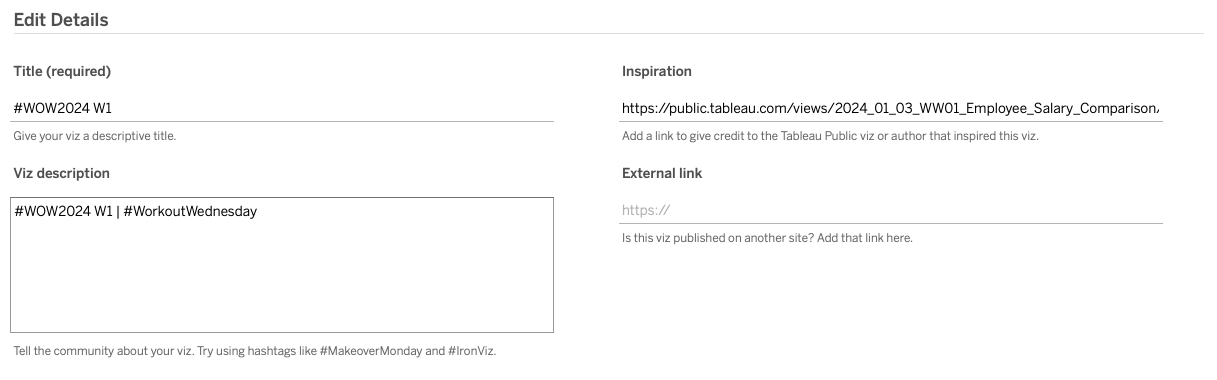
When you publish your solution on Tableau Public make sure to take the time and include a link to the original inspiration. Also include the hashtag #WOW2026 in your description to make it searchable!

Share
After you finish your workout, share on Twitter and/or LinkedIn using the hashtag #WOW2026 #Tableau and tag @WorkoutWednsday