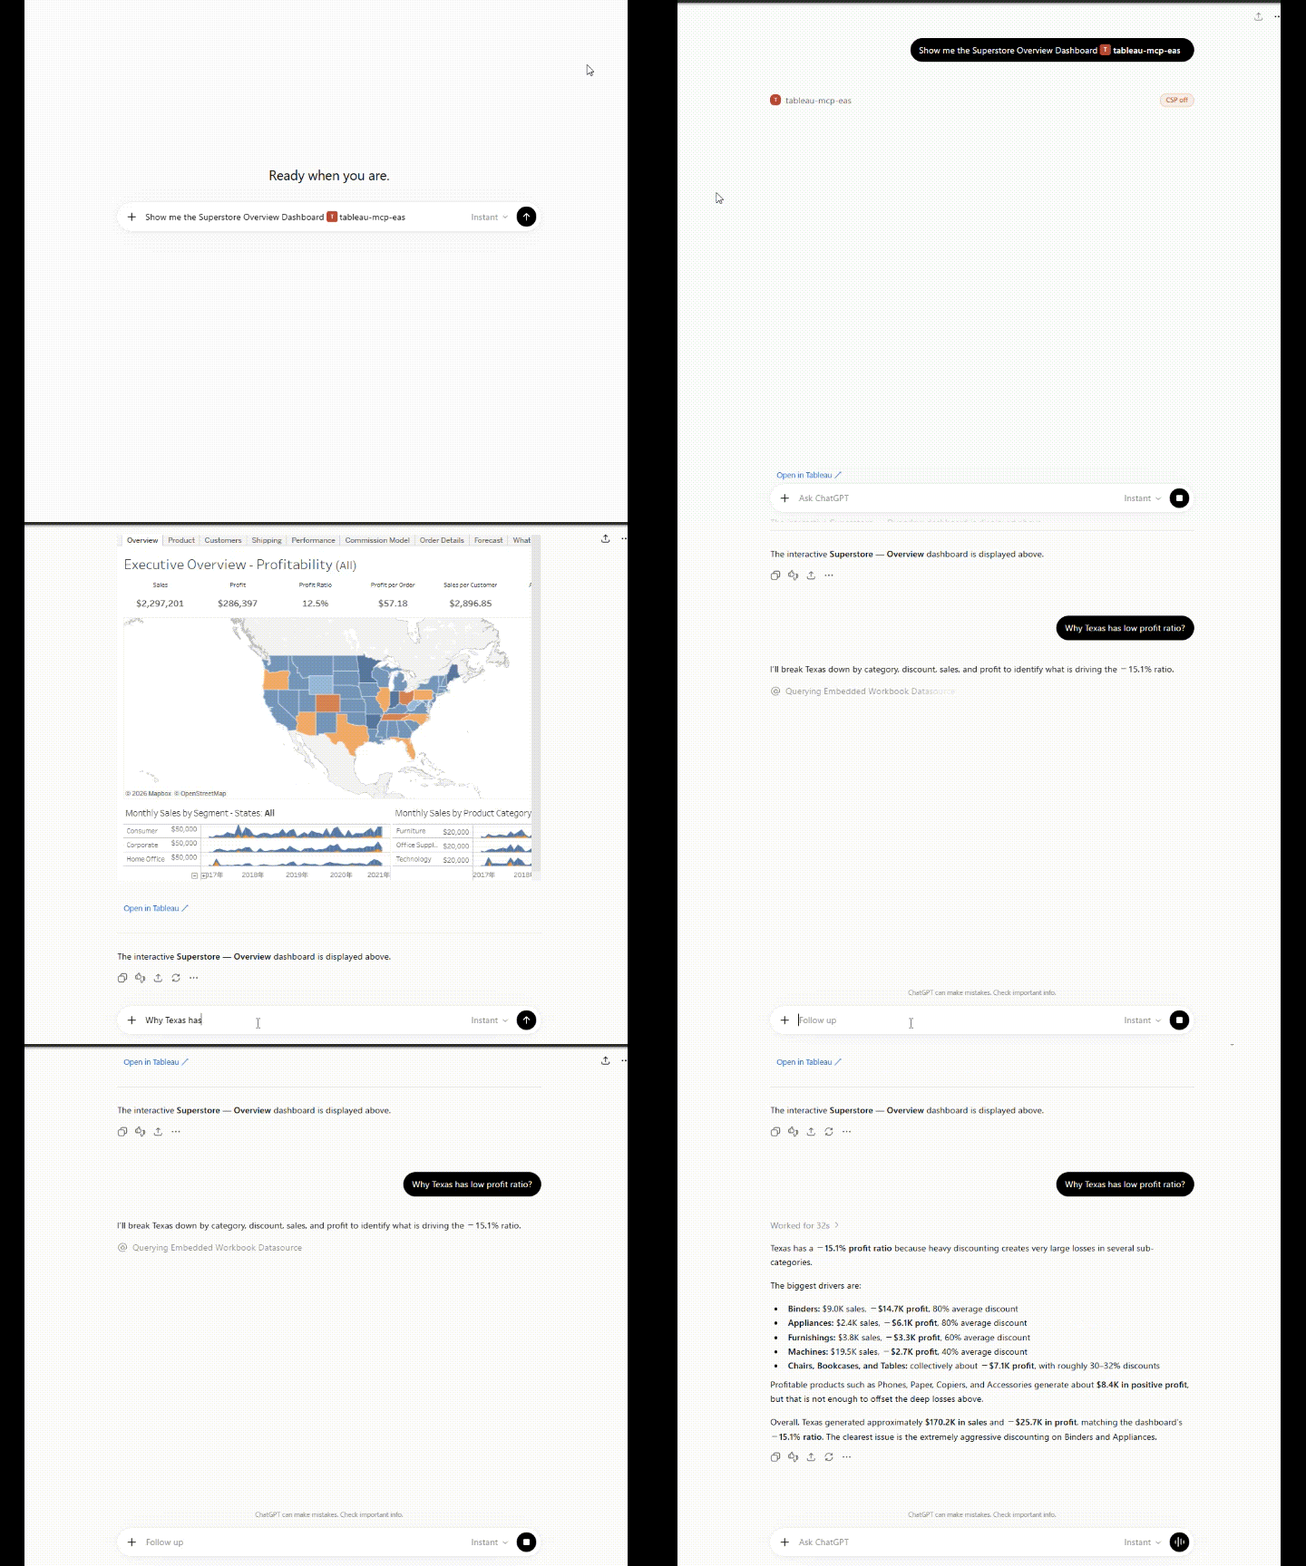
I have been running an experimental fork of the Tableau MCP server, trying to make dashboards live inside an AI chat. The piece I am most excited about is the viz state snapshot. You filter the embedded dashboard, the model gets told what you are now looking at, and it can go query the data source behind it. The dashboard stops being the end of the conversation and becomes something you and the agent are looking at together.
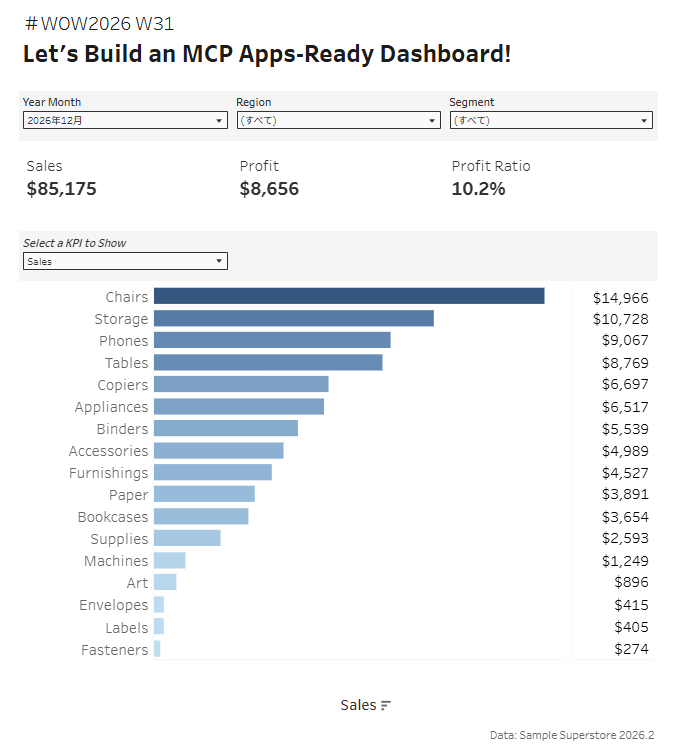
A dashboard built for that spot has to be small and it has to explain itself, because it turns up mid-conversation with nobody there to walk you through it. So this week, build one at close to mobile size.
On top of that, let’s try Tableau Public’s published data sources, which are new. Connecting to one is something you can only do in the browser, so this challenge is Web Authoring the whole way and Tableau Desktop stays closed. Overall, this challenge is relatively light. I hope you have fun!
Side note: I’ve been playing around with something like the GIF below.
Create KPI cards for Sales, Profit, and Profit Ratio.
Create a bar chart by Sub-Category showing a selected KPI.
Show the values to the right of the chart.
Add Order Date (Year Month), Region, and Segment filters.
Dataset
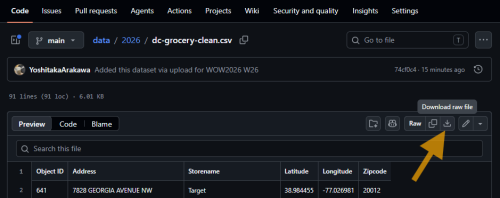
This challenge uses the Sample Superstore 2026.2. You can download the data here (GitHub).
Attribute
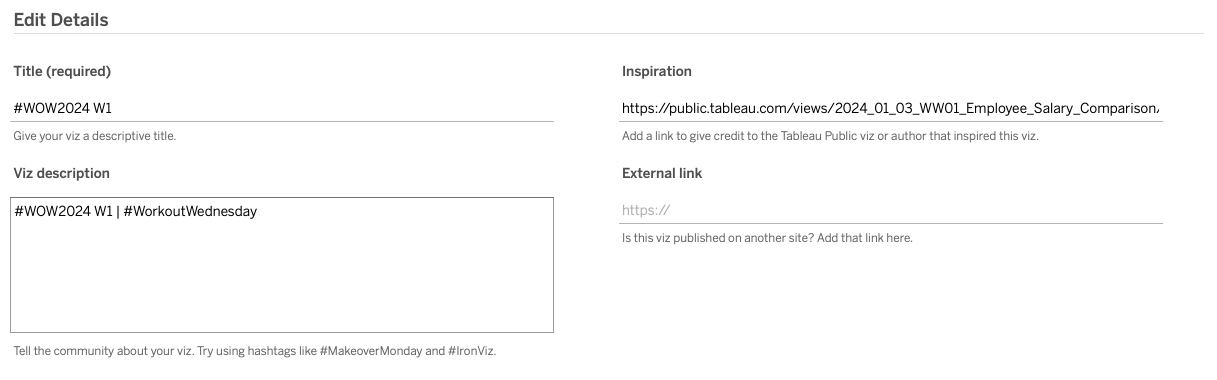
When you publish your solution on Tableau Public make sure to take the time and include a link to the original inspiration. Also include the hashtag #WOW2026 in your description to make it searchable!