I was struggling to think of a challenge for this week, so I went back to the archives and found this one. This is looking at Customer Spend Insights, which is looking at their first & second purchase, and whether they are deemed as Outliers or not
You have the option to choose between Table Calcs or LODs. I provided the solution in LODs, but you can do some of this with Table Calcs.
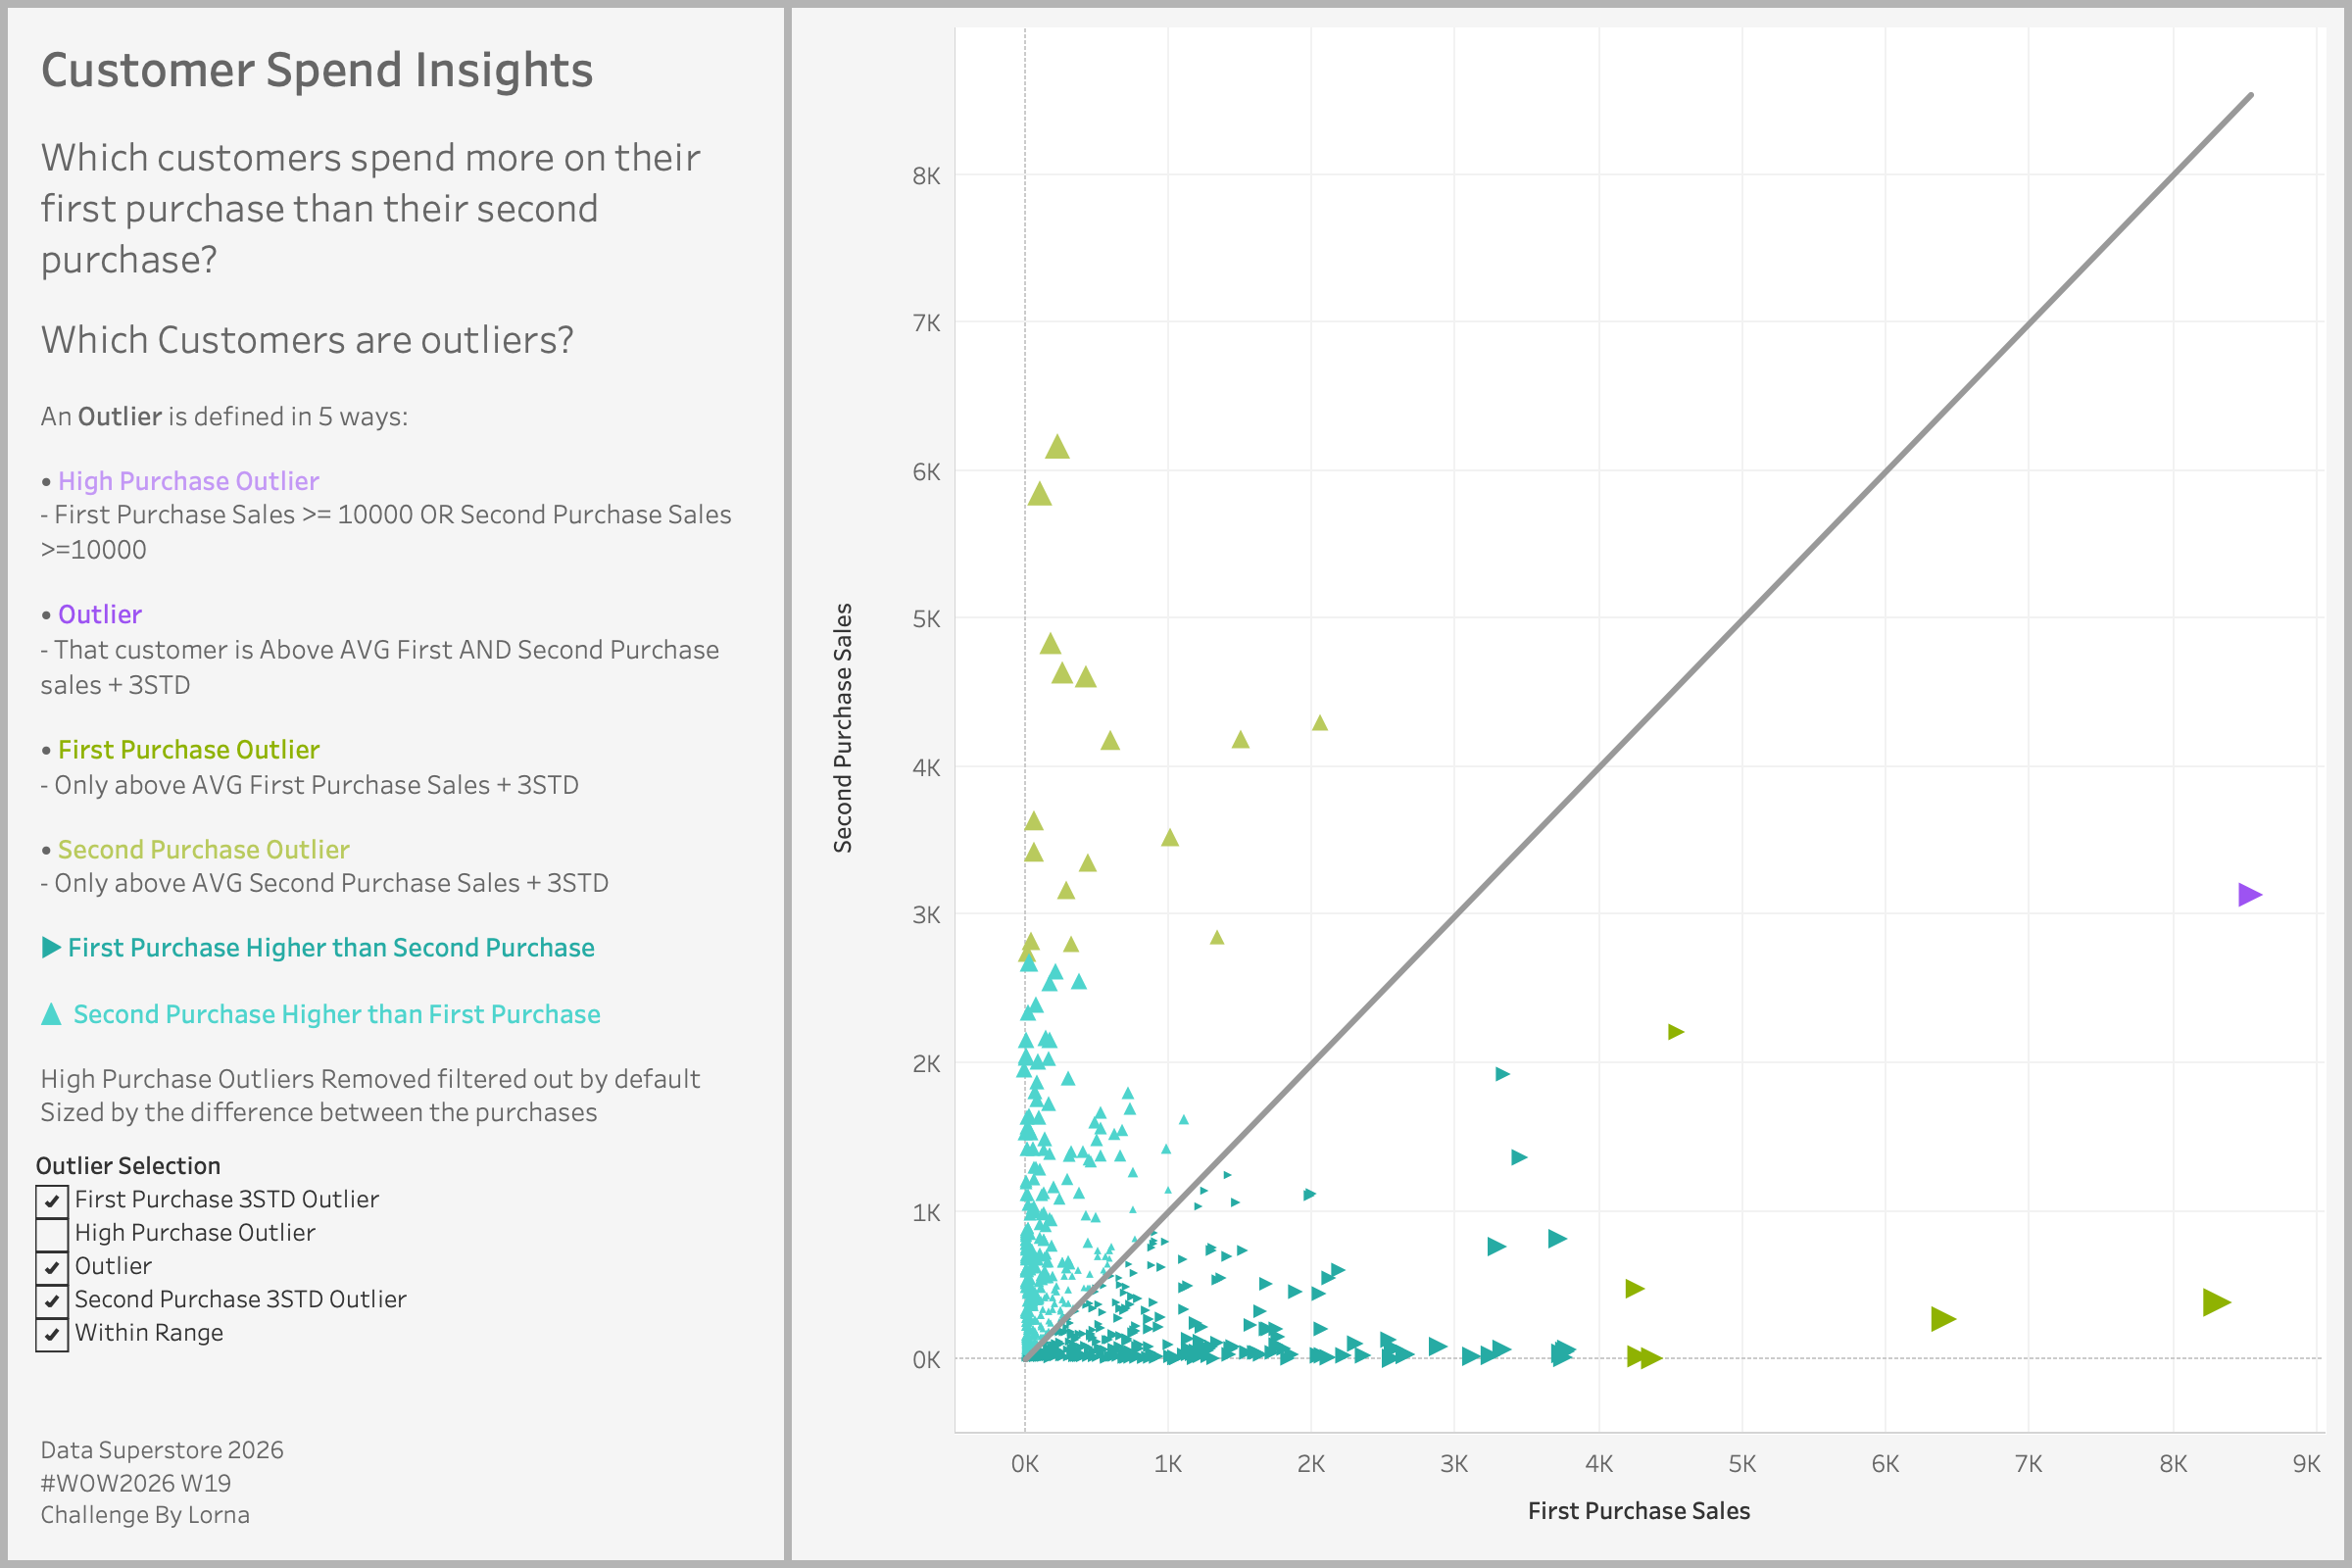
First Purchase Sales >= 10000 OR Second Purchase Sales >=10000
Outlier
That customer is Above AVG First AND Second Purchase sales + 3STD
First Purchase Outlier
Only above AVG First Purchase Sales + 3STD
Second Purchase Outlier
Only above AVG Second Purchase Sales +3STD
▶First Purchase Higher than Second Purchase
▲ Second Purchase Higher than First Purchase
High Purchase Outliers Removed filtered out by default
Sized by the difference between the purchases
Dataset
2026 Superstore
Attribute
When you publish your solution on Tableau Public make sure to take the time and include a link to the original inspiration. Also include the hashtag #WOW2026 in your description to make it searchable!