Introduction
Hello everyone, I’m very happy to be back for another year of Workout Wednesday!
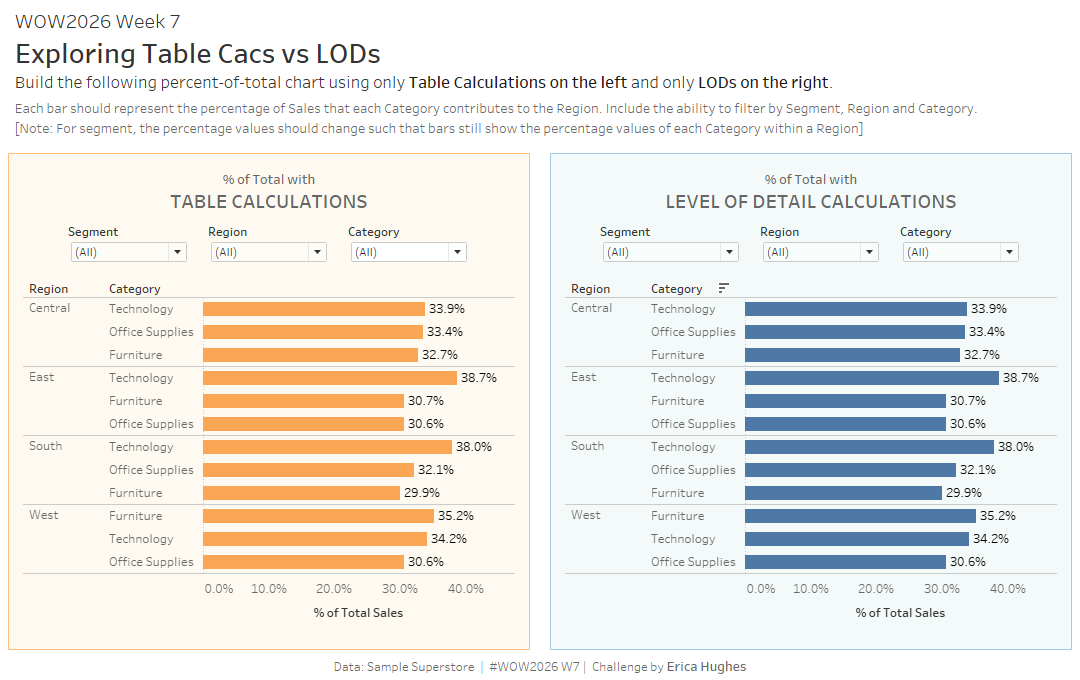
For my first challenge, I wanted to focus on something that every Tableau learner will encouter: Table Calculations and Level of Detail (LOD) Calculations, and what is the difference between them?
Well, sometimes only one of these types of calculations will work for you, but there are other times when you could choose to use either. Which one SHOULD you use? Of course, it depends! I hope this challenge helps you understand a little more so that you will be better prepared for different scenarios.
Requirements
Dashboard Size 1100 x 700
Complete the same challenge in two different ways (once with Table Calculations, once with LODs)
- Create a bar chart that represents the Category Sales as a percentage of the respective Region.
- Allow the user to filter by Segment, Region and Category
Note:
- Filtering out any Region should not affect the percentage values of the remaining the bars, and each Region should still add to 100%
- Filtering out any Category should not affect the percentage values of the remaining bars, but each Region will NOT add to 100%
- Filtering out any Segment SHOULD affect the percentage values of the remaining bars, as these should still represent the Category Sales as a percentage of the Region.
Dataset
This challenge uses Sample Superstore data (2025 version) with no filters applied. You can find the data source on Data.World
Attribute
When you publish your solution on Tableau Public make sure to take the time and include a link to the original inspiration. Also include the hashtag #WOW2026 in your description to make it searchable!

Share
After you finish your workout, share your solution:
- On Twitter using the hashtag #WOW2026 #Tableau and tag @WorkoutWednsday and @_hughej
- On LinkedIn using the tag Workout Wednesday, Tableau and Erica Hughes