2023

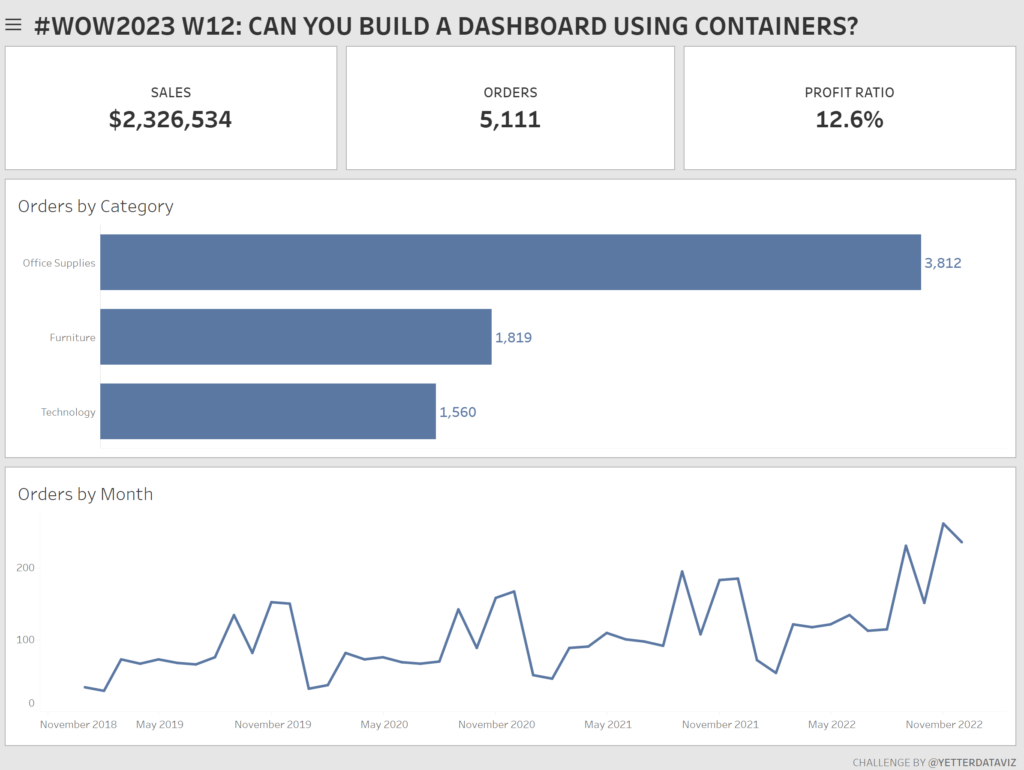
#WOW2023 | Week 12 | Can you build a dashboard using containers?

Introduction A few weeks ago I saw this Twitter poll (and the ensuing discussion) about Team Tiled vs Team Floating and I noted that I am neither. Rather, I am Team Container. Using Containers in dashboards makes positioning and sizing everything in your dashboard a piece of cake, once you have mastered how they work. […]

#WOW2023 | Week 12 | Can you build a dashboard using containers? Read More »

Tableau, Workout Wednesday
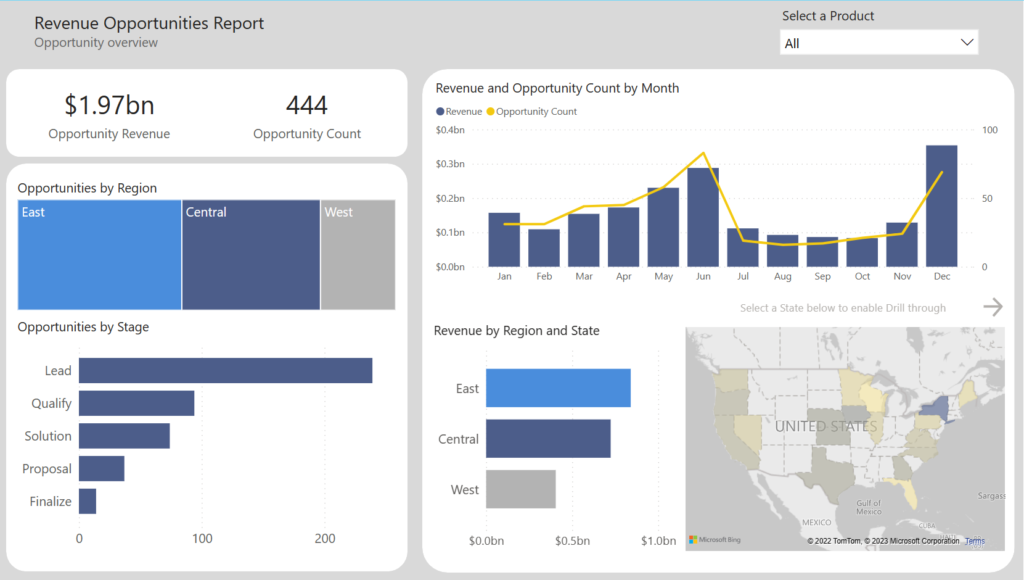
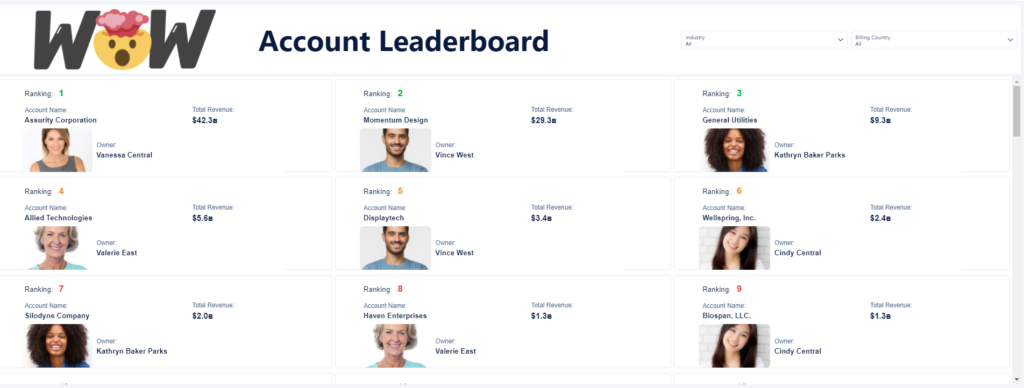
Image of Power BI report.

2023 Week 12 | Power BI: Are your reports accessible?

Introduction Welcome back to Workout Wednesday! This week we’re taking a note out of Meagan’s book and looking at existing reports to ensure they’re accessible to our end-users.  Creating accessible Power BI reports isn’t just a nice-to-have feature, but a crucial aspect for ensuring all users can access and understand your data. Don’t let accessibility

2023 Week 12 | Power BI: Are your reports accessible? Read More »

Power BI, Workout Wednesday

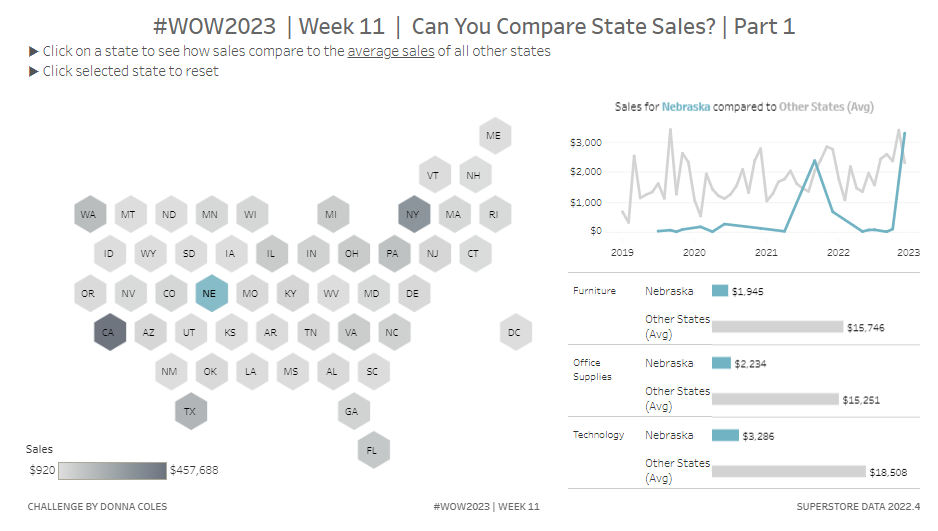
#WOW2023 | Week 11 | Can You Compare State Sales?

Introduction This week’s challenge is focused on interactivity, and was born out of a client requirement to compare store locations via selections from a map. I’ve naturally adapted it to use our favourite Superstore dataset. The core requirement is to be able to make a selection on the map and see how sales compare to

#WOW2023 | Week 11 | Can You Compare State Sales? Read More »

Tableau, Workout Wednesday
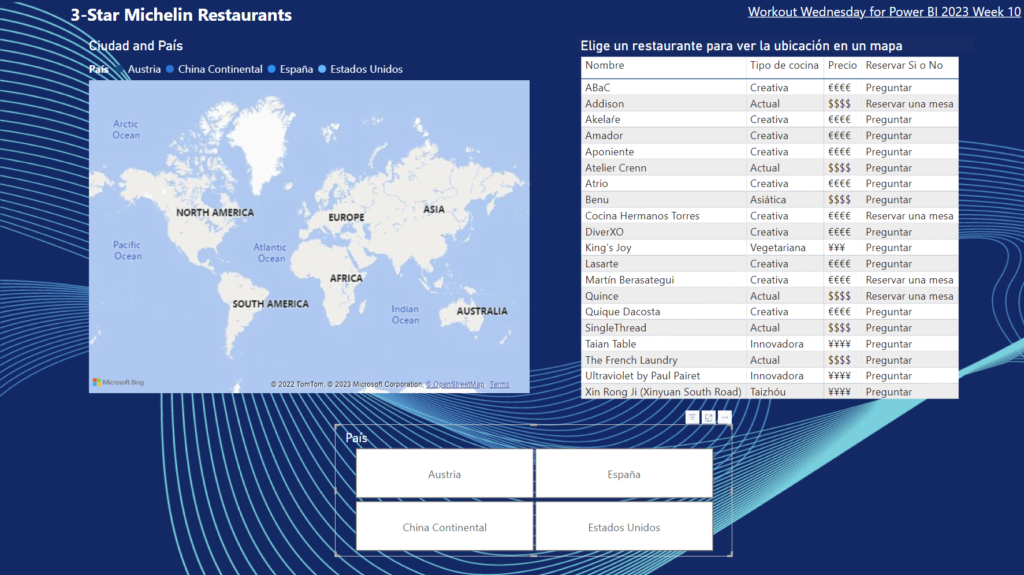
2023 Week 10 | Power BI: Mapping Cities with Michelin Star Restaurants

Introduction Note from the Editor: This week we have our first bilingual WoW for Power BI! Below you will find both the Spanish and English instructions for the exercise. Please note that the solution video is in Spanish, but auto-generated captions are available in English. If you enjoyed this, please let us know in the

2023 Week 10 | Power BI: Mapping Cities with Michelin Star Restaurants Read More »

Power BI

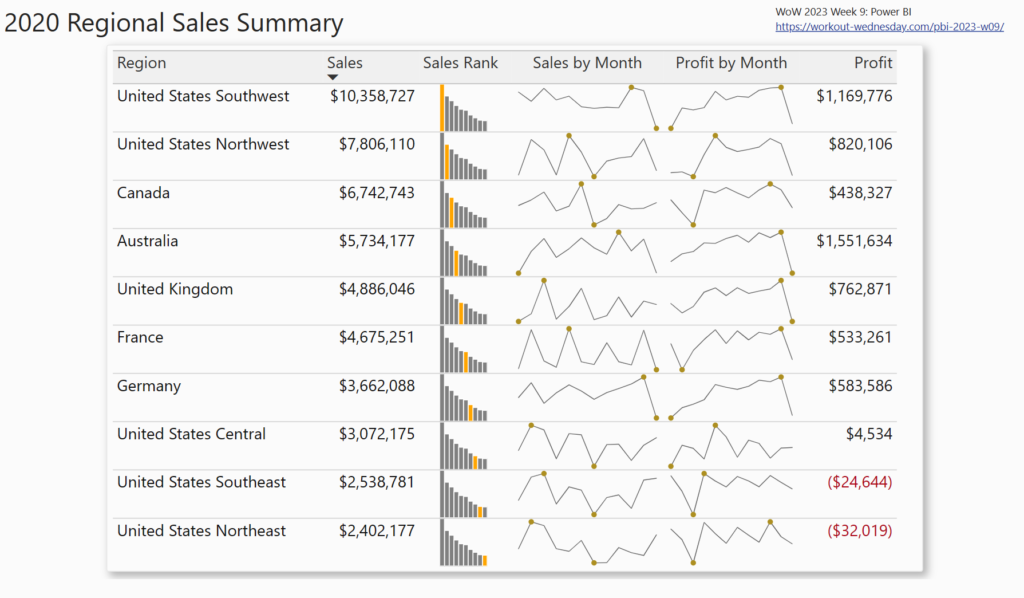
2023 Week 09 | Power BI: Create a table with custom and built-in microcharts

Introduction This week we are making a table with microcharts (sparklines). Power BI does offer built-in sparklines, but sometimes we want formatting options not available with the defaults. Our challenge this week uses both the built-in sparklines and custom SVG images in a table. Requirements Create a custom column with the following logic: If the

2023 Week 09 | Power BI: Create a table with custom and built-in microcharts Read More »

Power BI