This week’s challenge is a throwback to the 2017 week 8 #WOW challenge by then-coach, Emma Whyte. In 2017, Emma was the #WOW coach along with Andy Kriebel. If you want to dig in to some really fun challenge from the back in the day you can check out Andy’s 2017 challenge backlog on his site. However, you’ll also be able to see the requirements from Andy’s odd-week challenges. Emma’s challenges are available by screenshot only. This challenge is an attempt to resurrect that challenge…because is a really great challenge – The Marrimeko chart
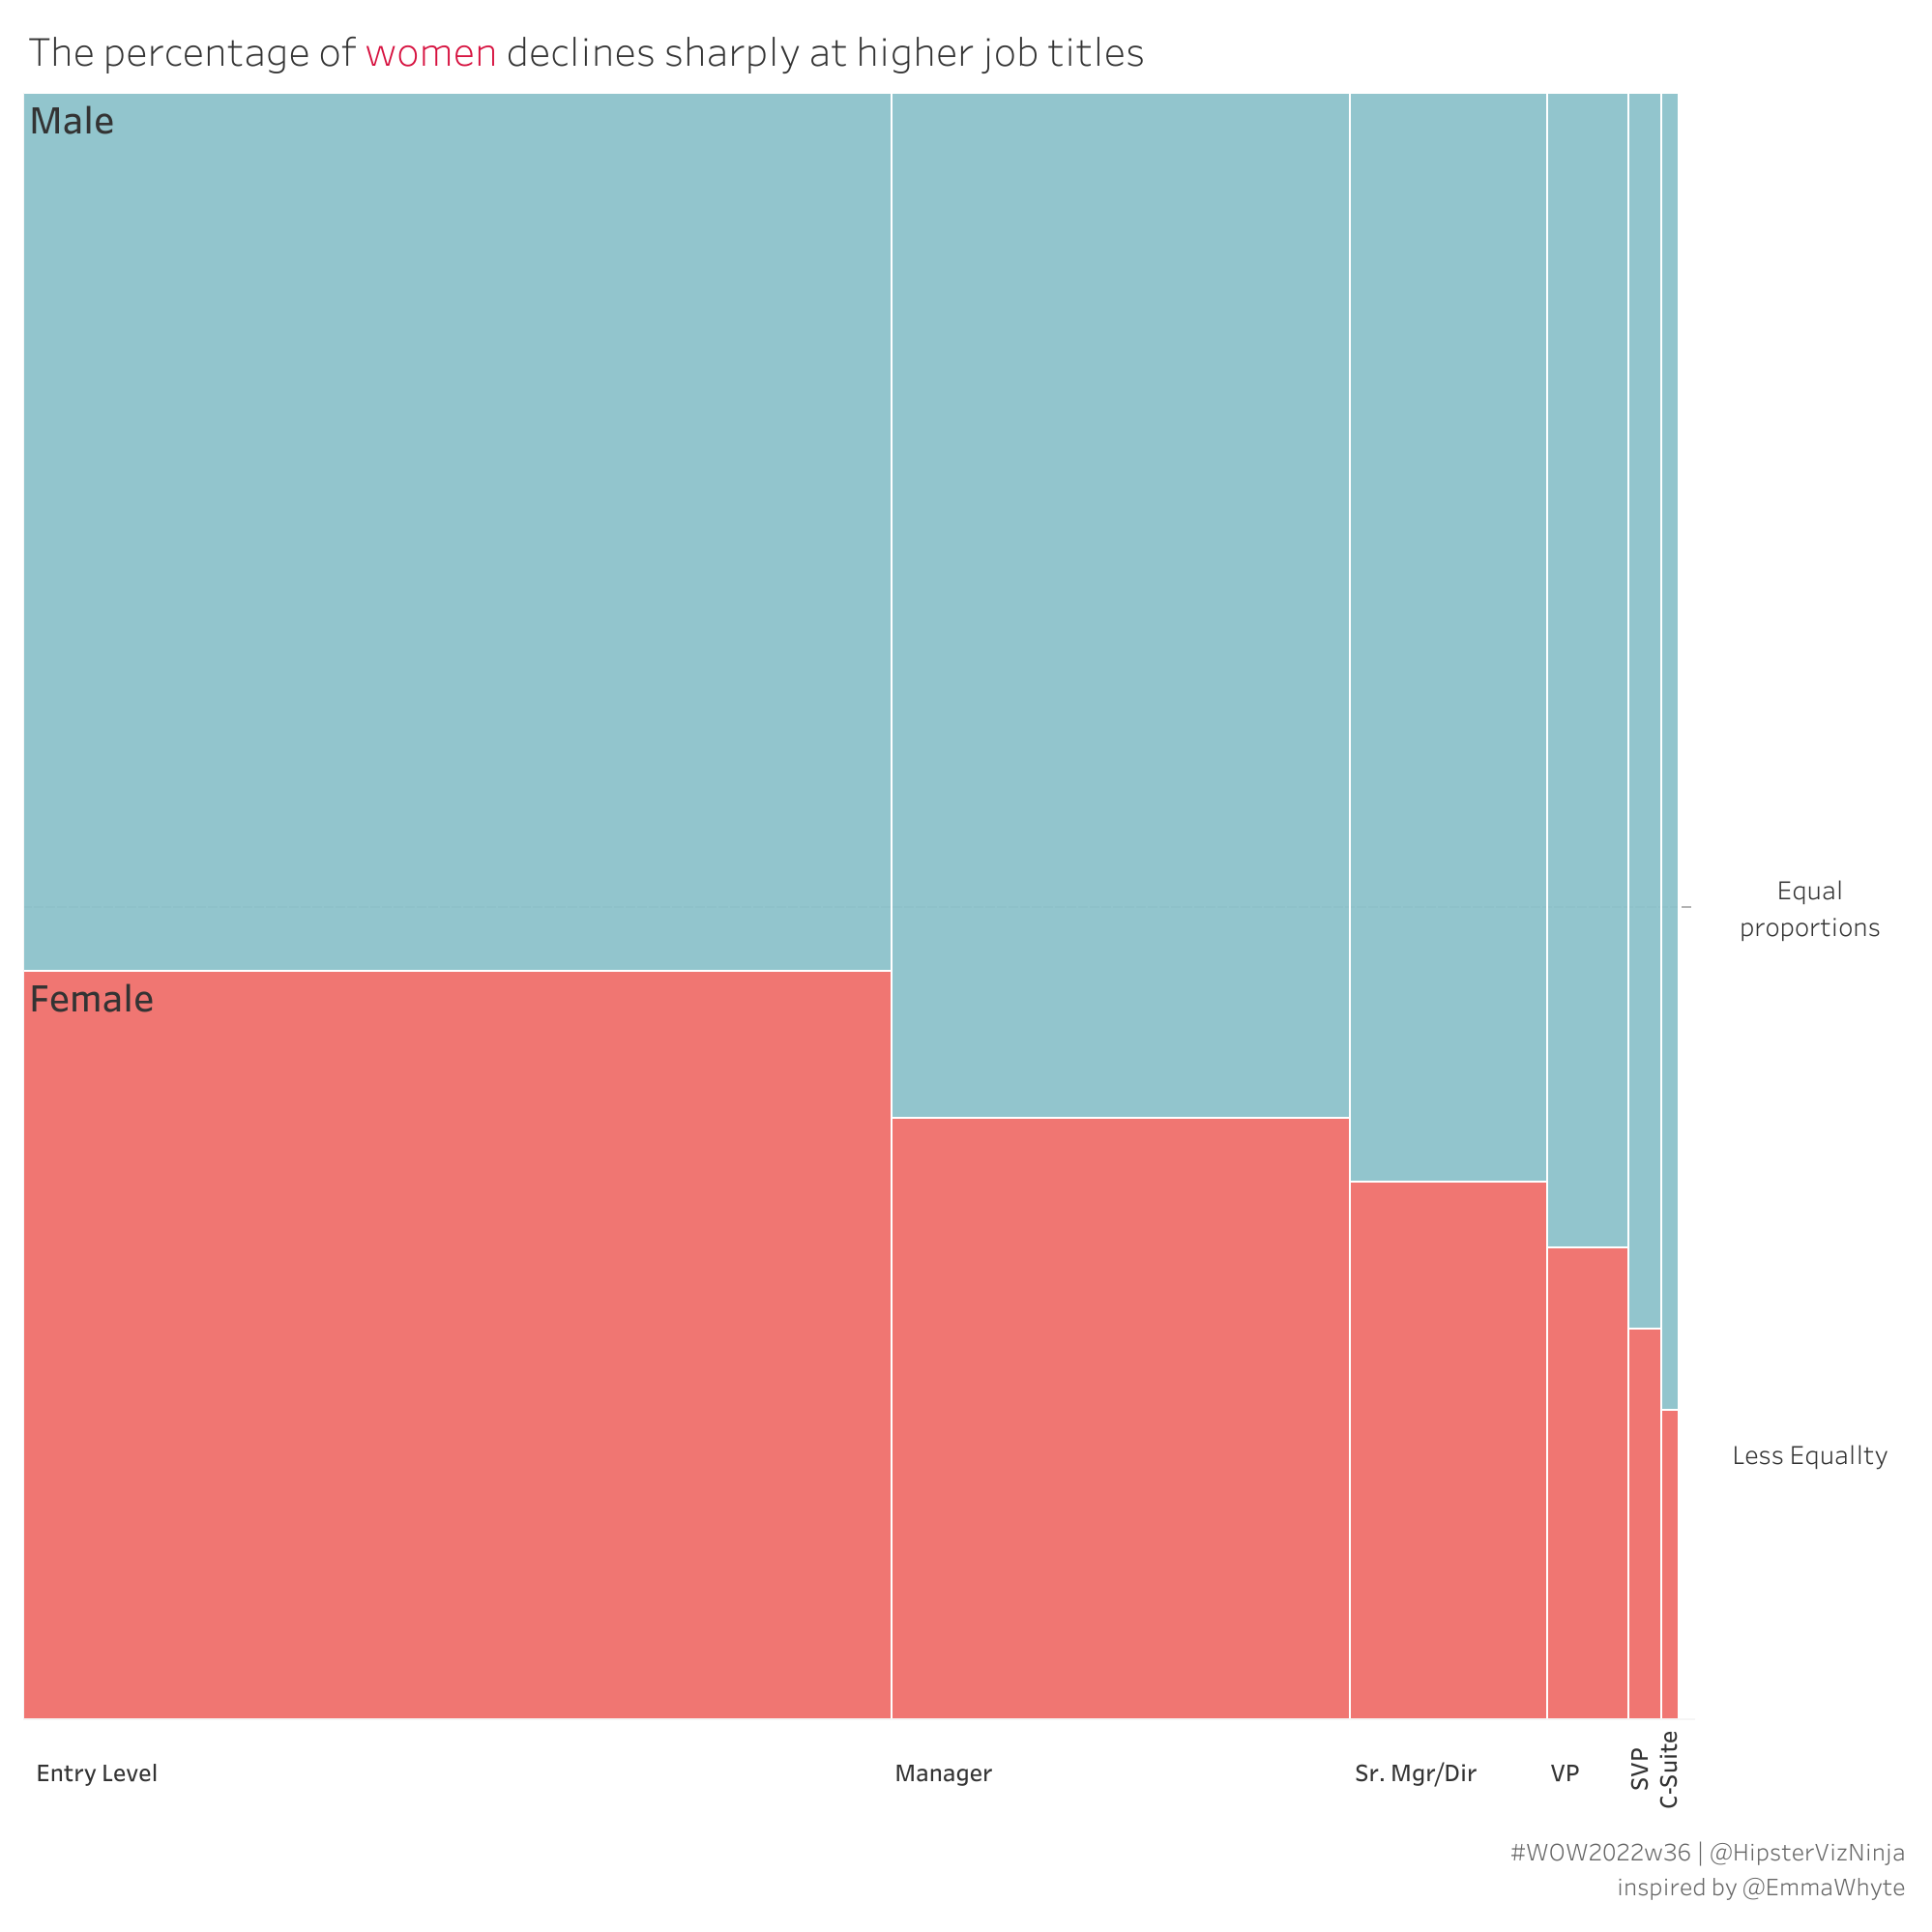
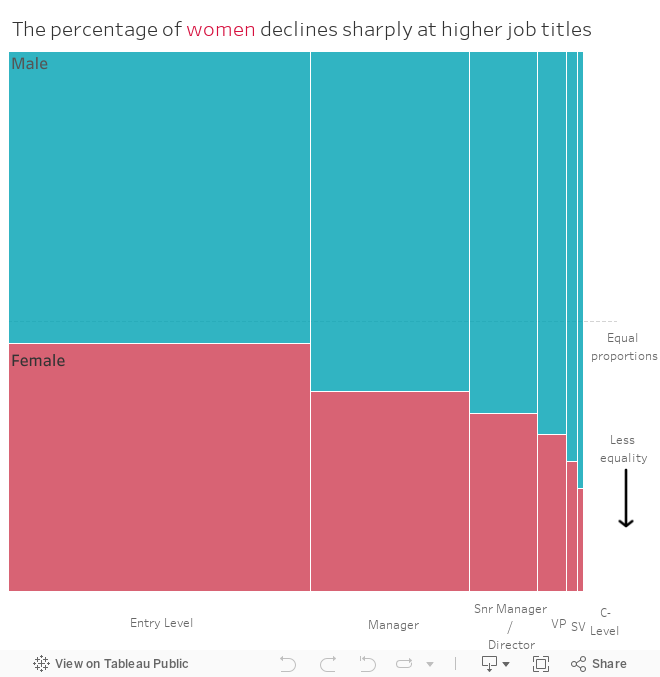
What is a Marrimeko chart or mosaic plot as it’s commonly referred to as? It “looks” like a treemap but it takes into account mulitple variables and show’s % of total on both axes. This will test your knowledge of table calcs and, likely, your google skills 😉
So with that, here’s your challenge this week. Have fun & good luck!
Create a Marrimeko that shows the distribution of workers by gender for each job type
Match formatting
Match tooltips
Dataset
This week uses the data from #MakeoverMonday 2016 week 24. You can get it off my Google Drive
Attribute
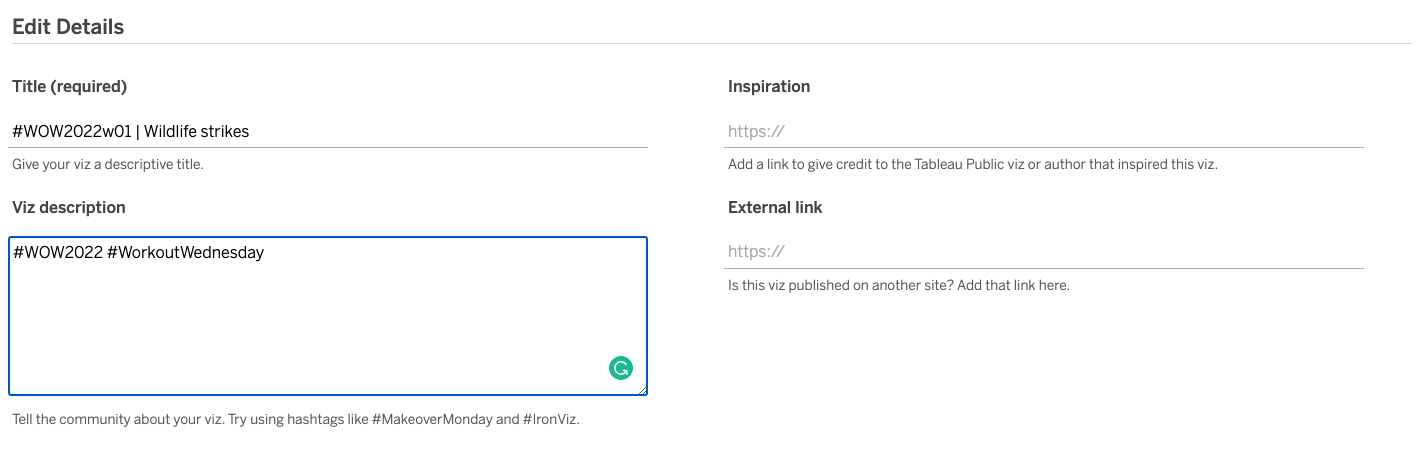
When you publish your solution on Tableau Public make sure to take the time and include a link to the original inspiration. Also include the hashtag #WOW2022 in your description to make it searchable!