Introduction
Fresh off the heels of the release of Tableau version 2020.4 comes a brand new exciting feature – MAP LAYERS!
One of the best things about #WorkoutWednesday is that our challenges are, generally, only difficult once. We have an entire backlog of challenges that you can go check out. And as Tableau releases new features, it offers unique opportunities for us to resurface old challenges through the lense of new desktop features! And that’s what this week’s challenge is going to do. We’re going to be back in time and redux an old mapping challenge (2019 week 11) with the new Map Layers feature.
Map layers let you enhance your geospatial analysis with multiple marks layer support for maps. You can now add unlimited marks layers from a single data source to your map visualizations, bringing multiple spatial layers and context together for better understanding and analysis.
This challenge is the just the tip of the iceberg of possibilities. When you are ready, go check out blogs by Zen Masters Jeffrey Shaffer and Luke Stanke have figured out is possible with this brand new feature. But first thing’s first, on this week’s challenge
Requirements
- Dashboard Size: Generic Desktop
- # of Sheets – up to you
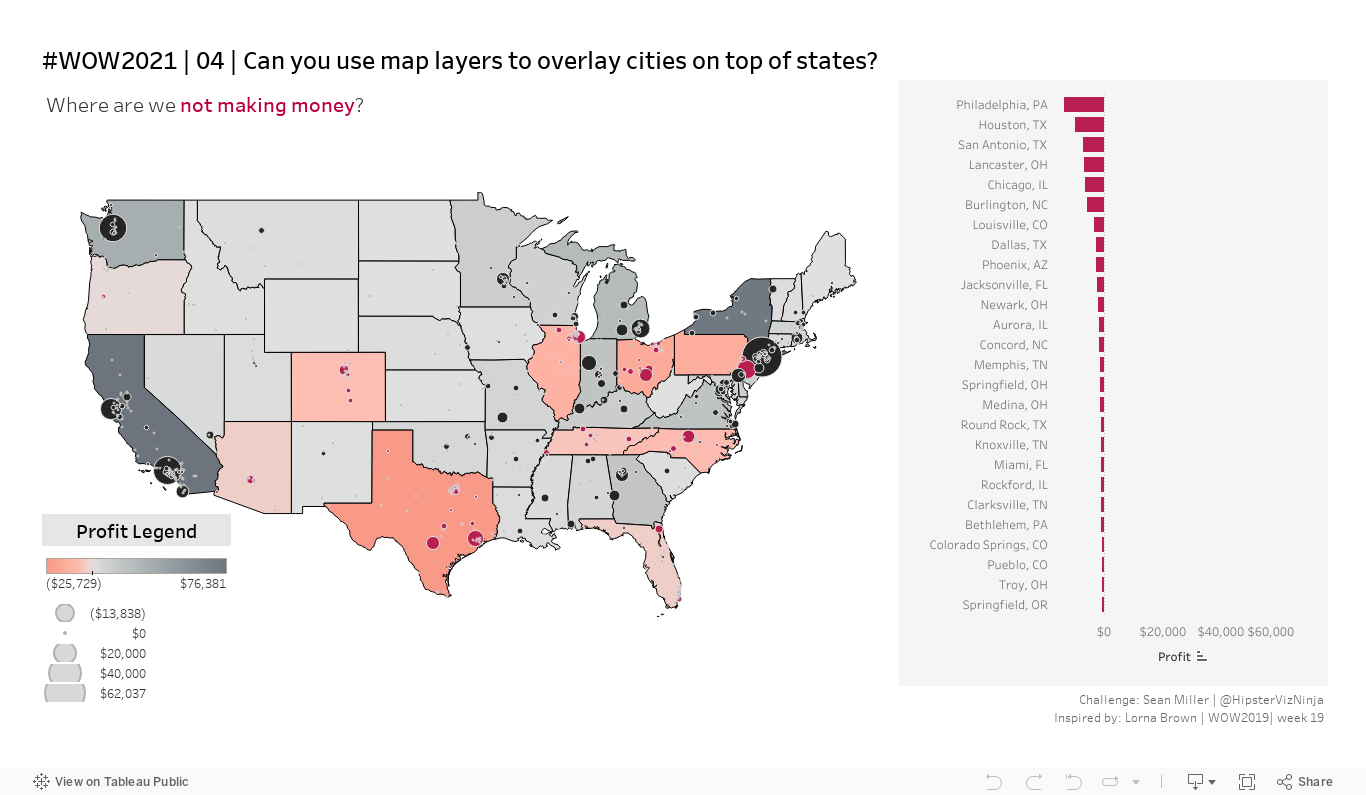
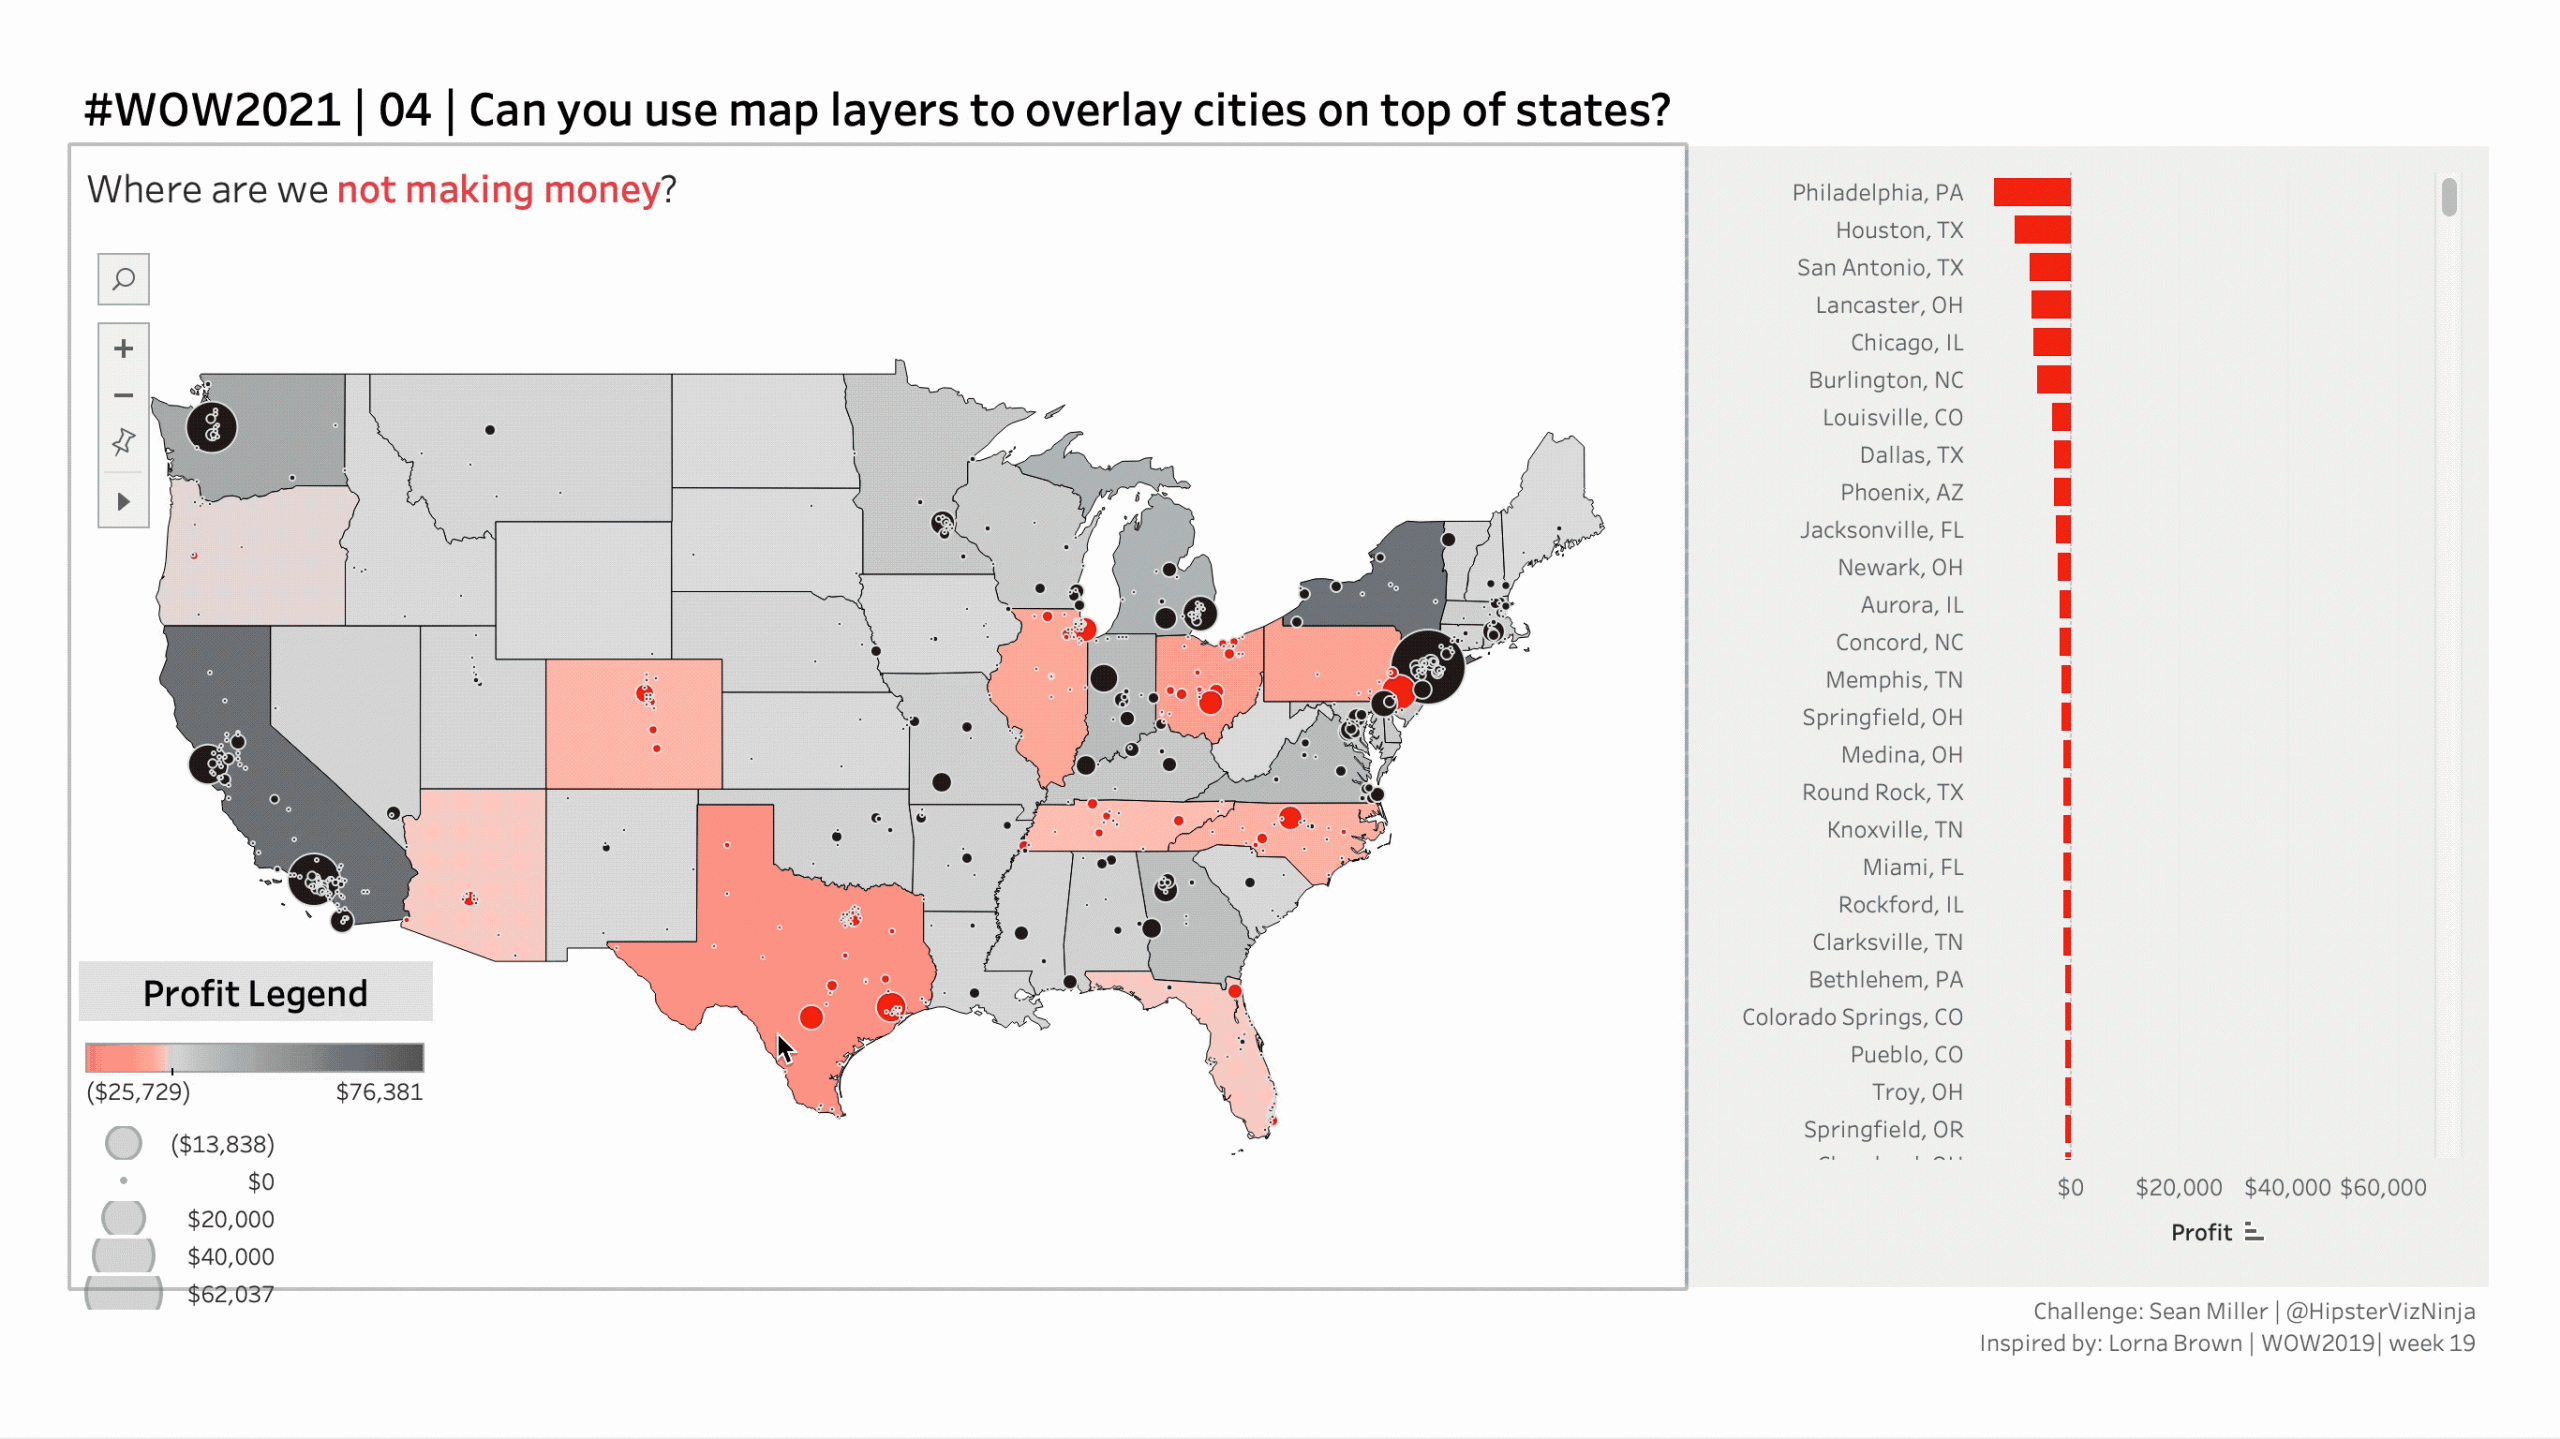
- Create a map with one (1) axis and multiple layers:
- State
- City
- Color state by total profit
- Size city by total profit
- Color city by sign (+/-) of total profit
- Mind those dynamic tooltips
- Ensure when you hover on the state, there’s no interactivity
- Create a bar chart of profit by city, sorted ascending
- And a hover action on the bar chart relating to the map and ensure NO ACTION on the map.
- Match all other formatting and layout
You will need to make use of State abbreviation. You can use the below calculation if you need it
//State Abbreviation
CASE [State]
WHEN “Alabama” THEN “AL”
WHEN “Alaska” THEN “AK”
WHEN “Arkansas” THEN “AR”
WHEN “Arizona” THEN “AZ”
WHEN “California” THEN “CA”
WHEN “Colorado” THEN “CO”
WHEN “Connecticut” THEN “CT”
WHEN “Delaware” THEN “DE”
WHEN “District of Columbia” THEN “DC”
WHEN “Florida” THEN “FL”
WHEN “Georgia” THEN “GA”
WHEN “Idaho” THEN “ID”
WHEN “Illinois” THEN “IL”
WHEN “Indiana” THEN “IN”
WHEN “Iowa” THEN “IA”
WHEN “Kansas” THEN “KS”
WHEN “Kentucky” THEN “KY”
WHEN “Louisiana” THEN “LA”
WHEN “Maine” THEN “ME”
WHEN “Maryland” THEN “MD”
WHEN “Massachusetts” THEN “MA”
WHEN “Michigan” THEN “MI”
WHEN “Minnesota” THEN “MN”
WHEN “Mississippi” THEN “MS”
WHEN “Missouri” THEN “MO”
WHEN “Montana” THEN “MT”
WHEN “Nebraska” THEN “NE”
WHEN “Nevada” THEN “NV”
WHEN “New Hampshire” THEN “NH”
WHEN “New Jersey” THEN “NJ”
WHEN “New Mexico” THEN “NM”
WHEN “New York” THEN “NY”
WHEN “North Carolina” THEN “NC”
WHEN “North Dakota” THEN “ND”
WHEN “Ohio” THEN “OH”
WHEN “Oklahoma” THEN “OK”
WHEN “Oregon” THEN “OR”
WHEN “Pennsylvania” THEN “PA”
WHEN “Rhode Island” THEN “RI”
WHEN “South Carolina” THEN “SC”
WHEN “South Dakota” THEN “SD”
WHEN “Tennessee” THEN “TN”
WHEN “Texas” THEN “TX”
WHEN “Utah” THEN “UT”
WHEN “Vermont” THEN “VT”
WHEN “Virginia” THEN “VA”
WHEN “Washington” THEN “WA”
WHEN “West Virginia” THEN “WV”
WHEN “Wisconsin” THEN “WI”
WHEN “Wyoming” THEN “WY”
END
Dataset
This week uses the superstore dataset for Tableau 2020.4. If you need a version of Superstore to get you started you can get it version 2019.4 here at data.world.
Attribute
When you publish your solution on Tableau Public make sure to take the time and include a link to the original inspiration. Also include the hashtag #WOW2021 in your description to make it searchable!
Share
After you finish your workout, share on Twitter using the hashtag #WOW2021 and tag @AnnUJackson, @ItsCandraM, @LukeStanke, @_Lorna_Brown and @HipsterVizNinja
Solution
Interactive