2020

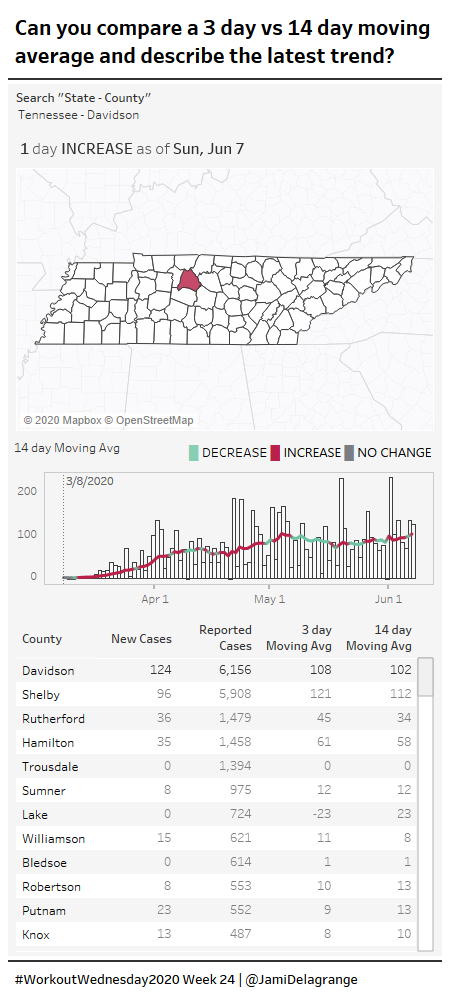
2020 Week 24: Can you compare a 3-day vs. 14-day moving average and describe the latest trend?

Introduction I’ve got an exciting challenge for you this week!  It involves collaboration with a peer of mine in the data community (Jami Delagrange, who you may recognize as an upcoming Community Month contributor) and also a challenge that involves working with COVID-19 data. This built-for-mobile dashboard was born out of seeking to understand the […]
2020 Week 24: Can you compare a 3-day vs. 14-day moving average and describe the latest trend? Read More »

Tableau, Workout Wednesday

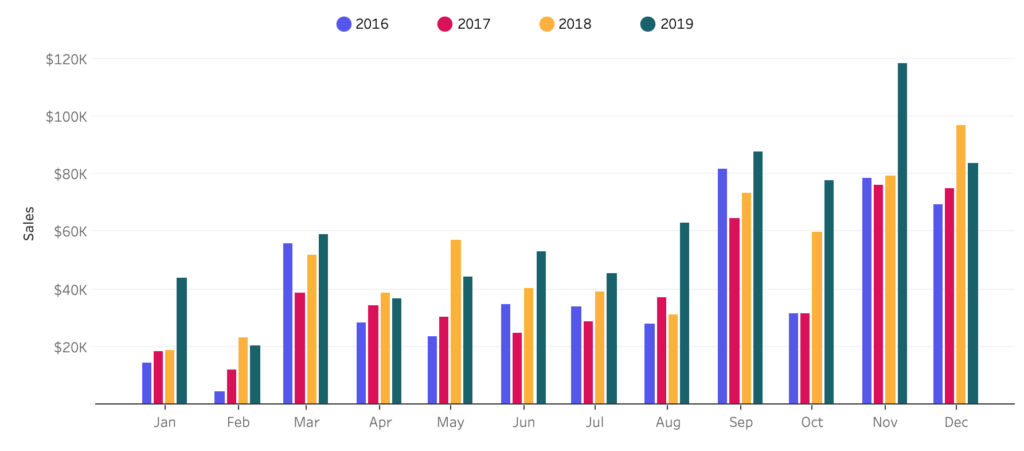
2020 Week 23: Can you excel at bar charts?

Introduction This week’s challenge is relatively straight-foward: remake a bar chart to look like a Microsoft Excel bar chart. The key to this chart is the extra whitespace between months. Click to open in Tableau Public Requirements Dashboard Size: 900px by 500px Show sales by month for each of the four years. Each bar should

2020 Week 23: Can you excel at bar charts? Read More »

Tableau, Workout Wednesday

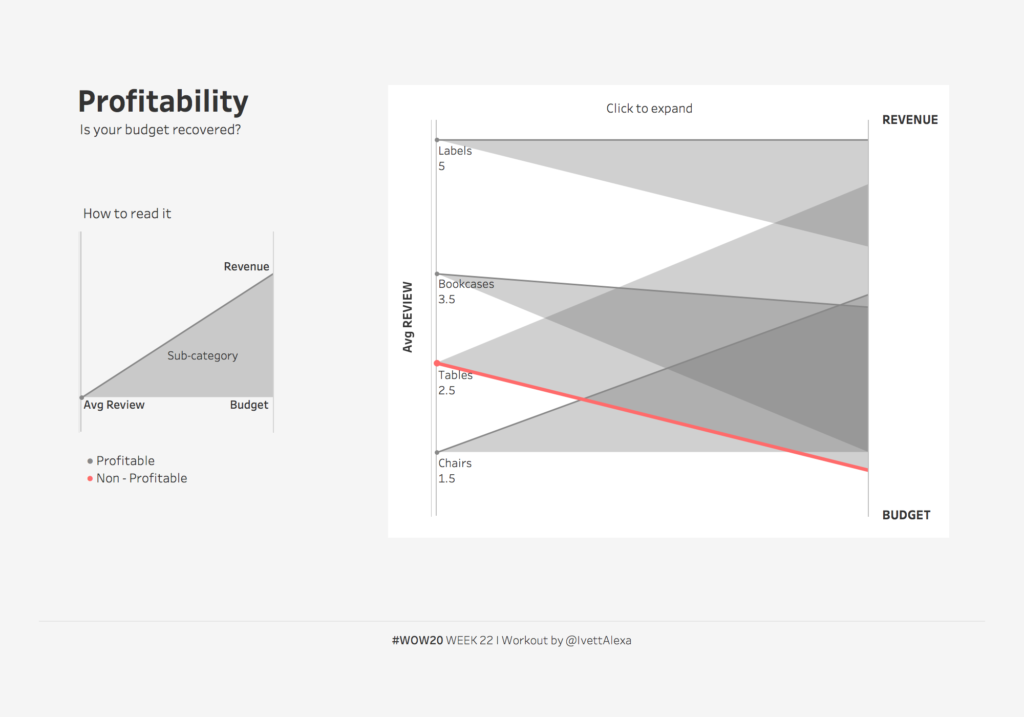
2020 Week 22: Profitability spotlight – is your budget recovered?

Introduction This week’s goal is to create a bi-dimensional chart (alternative parallel chart) that reveals if your budget has recovered or not. Parallel Coordinates represent multi-dimensional data across a set of vertical axis- different measures have different scales -, for this week’s challenge you will have to figure out how to show 2 different measures

2020 Week 22: Profitability spotlight – is your budget recovered? Read More »

Tableau, Workout Wednesday

2020 Week 21: Can you design for an automatic phone layout?

Introduction Creating the perfect dashboard requires time and patience, do we put the same amount of effort into creating dashboards ready made for mobile. This weeks shows how best to build a desktop dashboard for the automatic mobile layout. As mentioned by Bridget Cogley. Tableau’s automatic phone layout follows the a-z pattern. So top left

2020 Week 21: Can you design for an automatic phone layout? Read More »

Tableau, Workout Wednesday

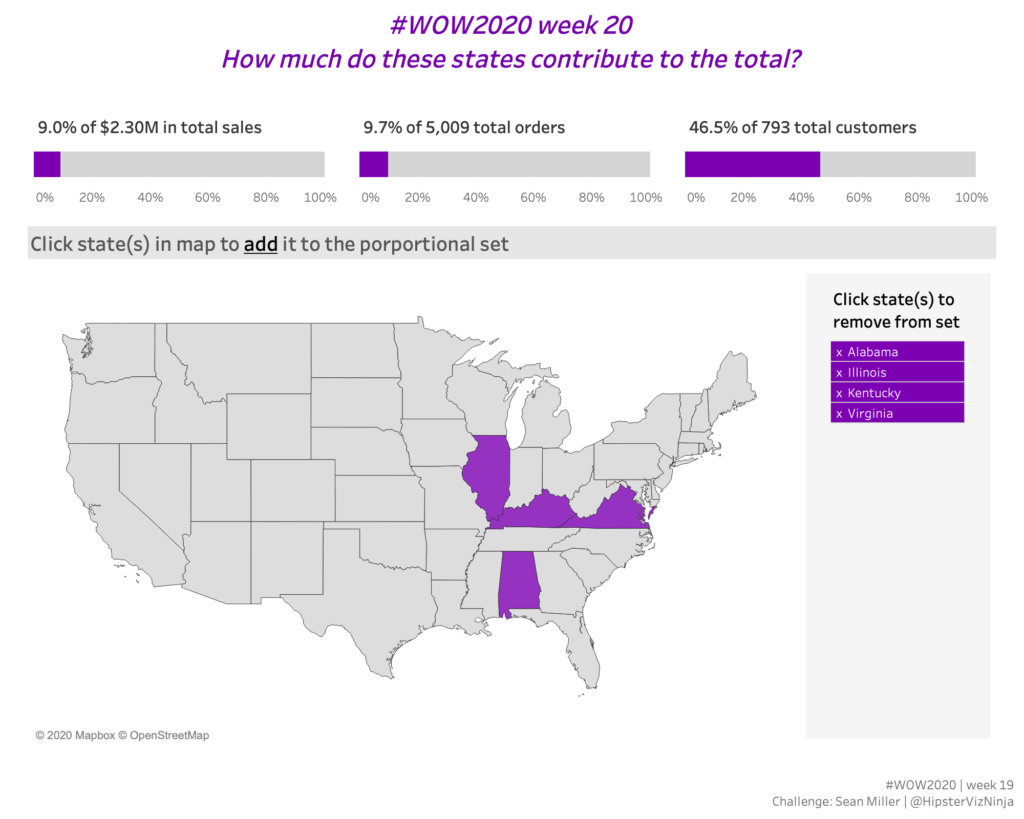
2020 Week 20: How much do these states contribute to the total?

Introduction What’s up #WOWzers! Have you heard the news? Tableau just release a feature-packed release with v2020.2. So many cool new features to try out and the #WOW2020 enjoyed my new feature challenge so much last time, they invited me back to do a challenge for this release too! One new feature that I’d been looking

2020 Week 20: How much do these states contribute to the total? Read More »

Tableau, Workout Wednesday

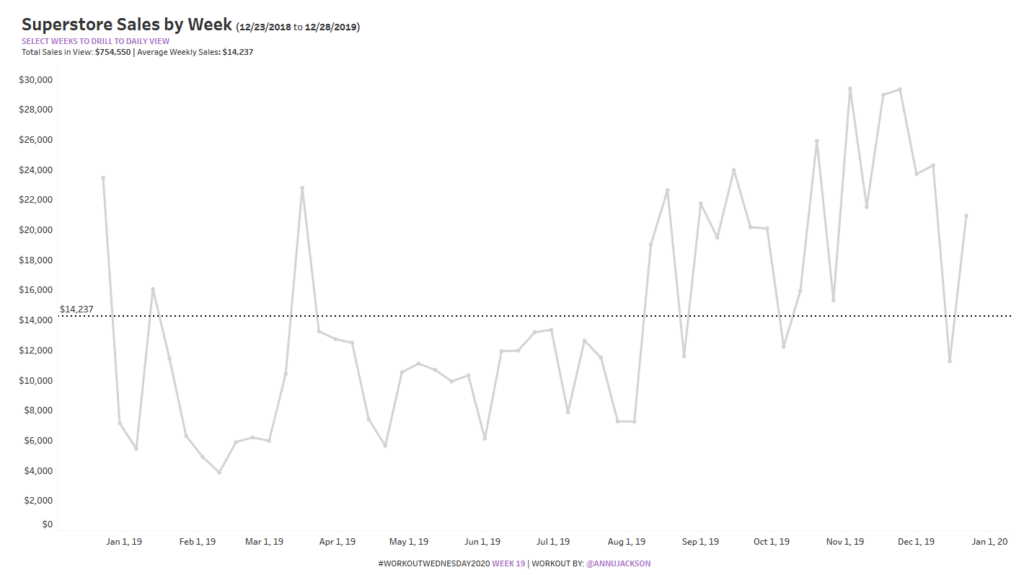
2020 Week 19: Can you build a dynamic date drilling chart?

Introduction I hope everyone is continuing to stay safe and sane during this time. Our challenge for the week is to work with dates again!  This one comes from a recent experience I had – the idea is pretty simple, you start your process by looking at more aggregated data, then you want to drill

2020 Week 19: Can you build a dynamic date drilling chart? Read More »

Tableau, Workout Wednesday

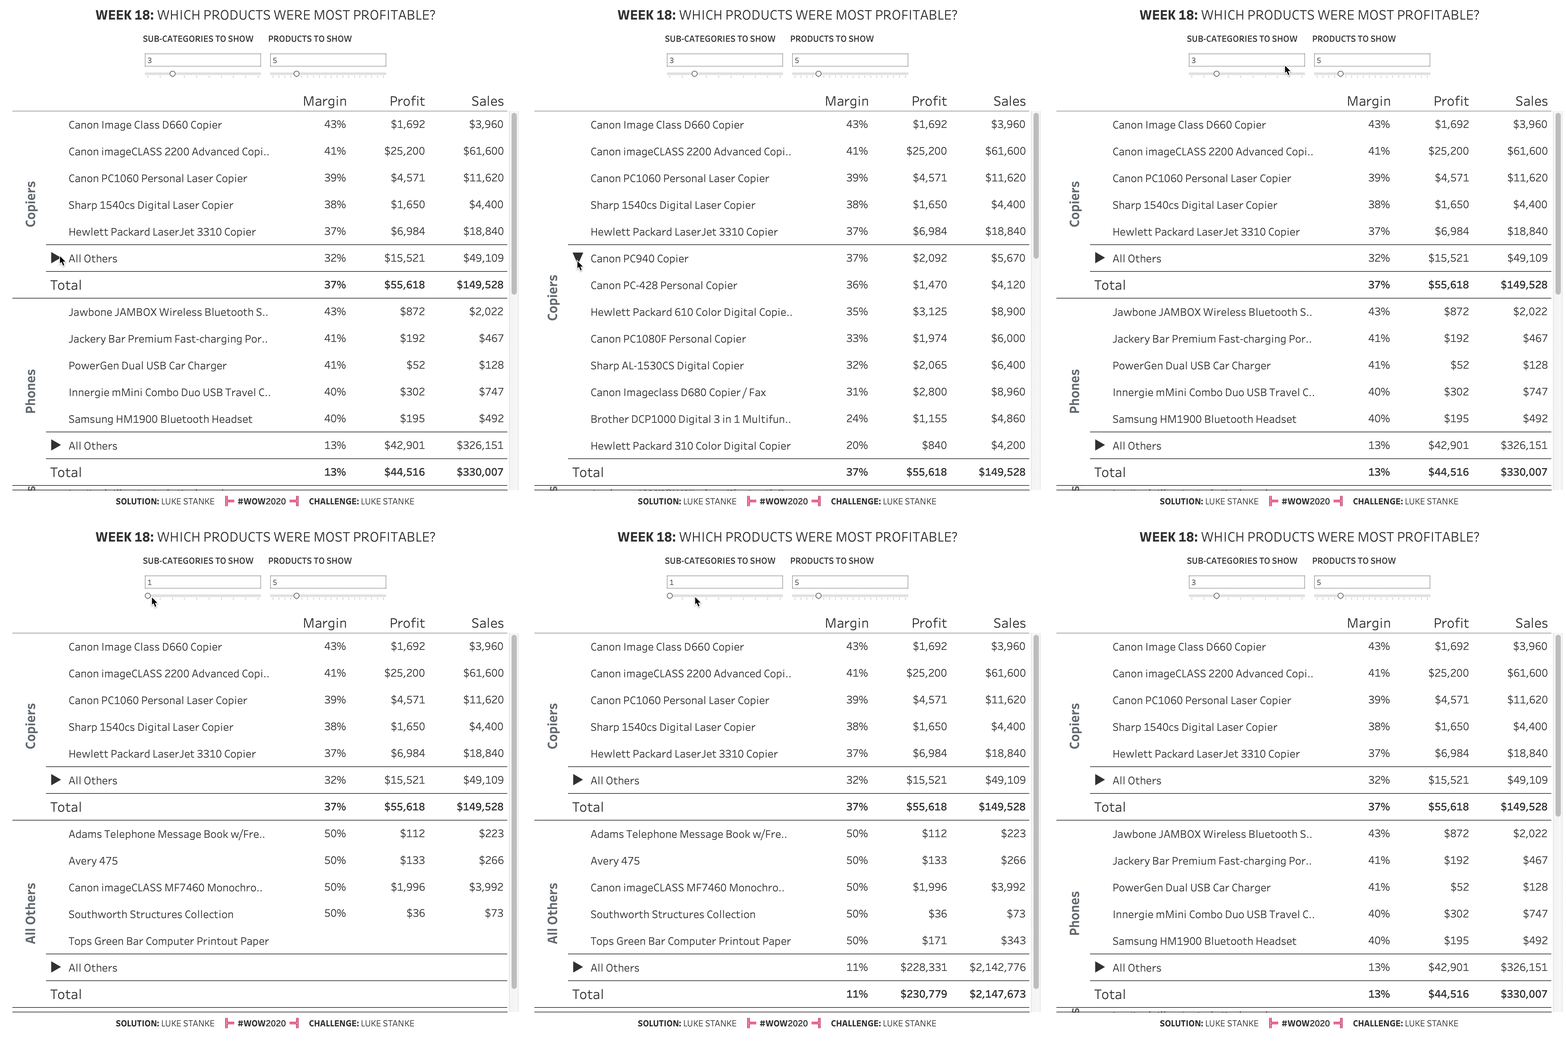
2020 Week 18: Which products were most profitable?

Introduction Sometimes you want to make fun charts, but life gives you tables. This challenge is another real-life challenge I’ve encountered through Dr. Alicia Bembenek: show a table, but only highlight a subset of the products. An innocent challenge that is actually more difficult than it first appears. –LS. Be sure to check out the

2020 Week 18: Which products were most profitable? Read More »

Tableau, Workout Wednesday

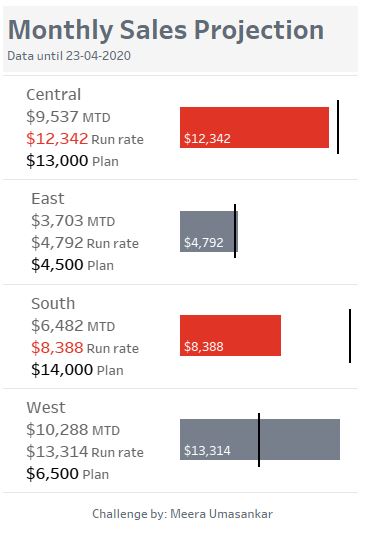
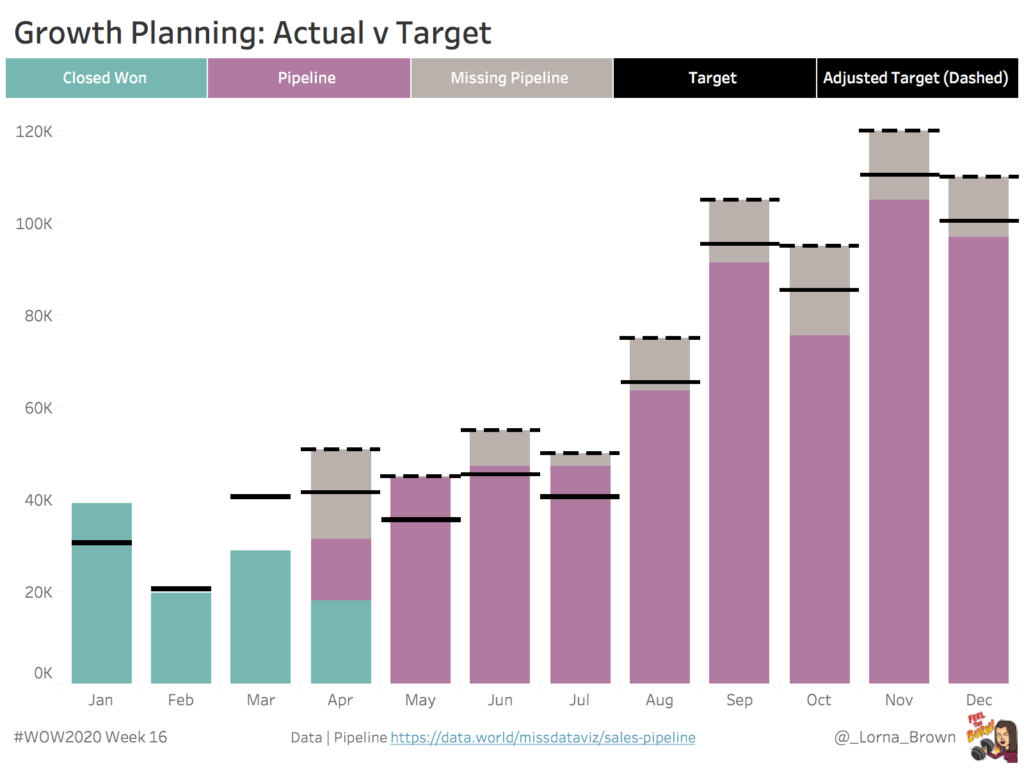
2020 Week 16: Can you show the adjusted target & missing pipeline?

Introduction This week I was challenged with building a chart which shows an Adjusted target and the missing pipeline if targets were not met. So I challenge you, can you adjust the targets and show missing pipeline from the adjusted target. Click to open in Tableau Public Requirements Dashboard Size: 800 x 600 px #

2020 Week 16: Can you show the adjusted target & missing pipeline? Read More »

Tableau, Workout Wednesday

2020 Week 15: Can you create a chart with a dynamic week start?

Introduction Hello Everyone!  First – I want to say that I hope you and your loved ones are happy, healthy, and safe during this time.  It’s amazing to think when I posted my last workout just 4 weeks ago, that the world (at least mine) looked completely different. I want you to know that you’re

2020 Week 15: Can you create a chart with a dynamic week start? Read More »

Tableau, Workout Wednesday