Introduction
For the longest time, I avoided table calculations as much as I could because I thought they were overly complicated (compute using…relative to…sort by…nested…ughhhh) especially when I had LODs in my back pocket. But, over time, I’ve made my peace with them (dare I say, a fan now) as I recognized how powerful they are and how they could amplify all of the things I loved about the #1 in my Tableau heart…LODs.
Recently, I was working with a stakeholder that wanted
- To be able to see the full trend of a measure
- To be able to select any point along the line and display the results for the selection
- To understand the % difference between two points along the line
- To give users the ability to change the comparison scenario in case the user wanted to see the change vs. the oldest, most recent, or previous value
Requirements
- No Level of Detail Expressions/LODs
- No Calculated Field to Transform Number Format to Percentages
- No hardcoded years in calculated field
- # of Views – 1
- Match tooltips, colors, formatting
- Selected Year Mark Color: #f0007b
- Unicode for the variance arrows: ▲ U+25B2; ▼ U+25BC (note the treatment of no change)
- Dashboard Size: (1000px x 800px)
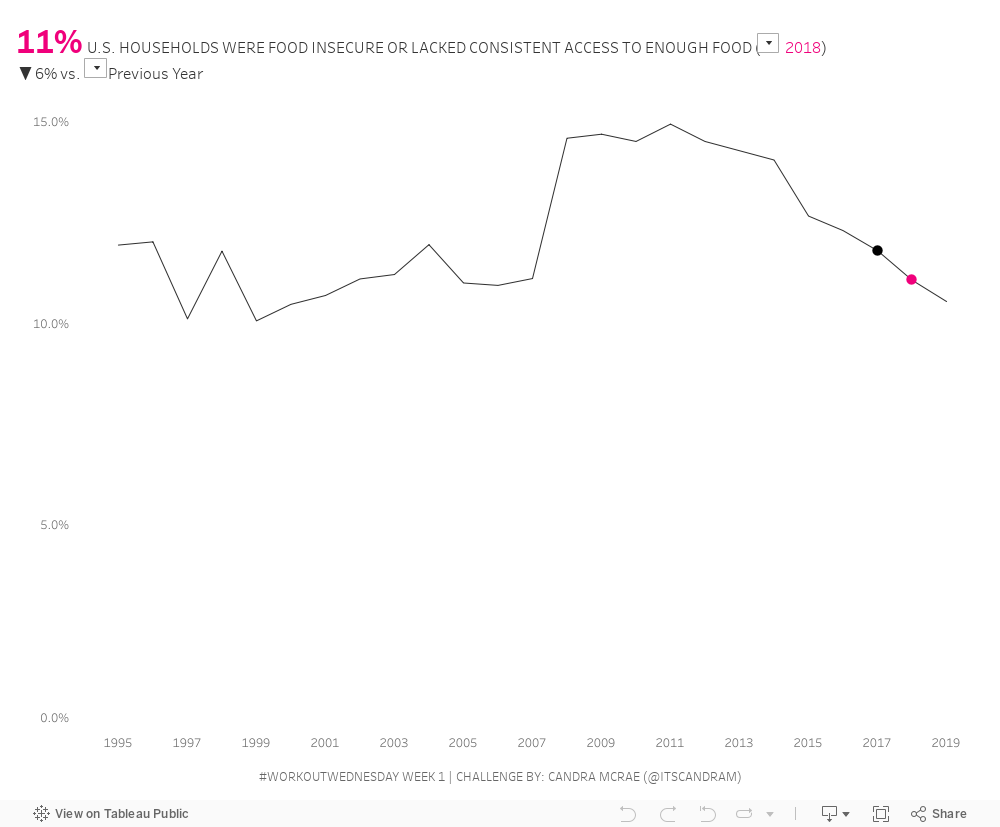
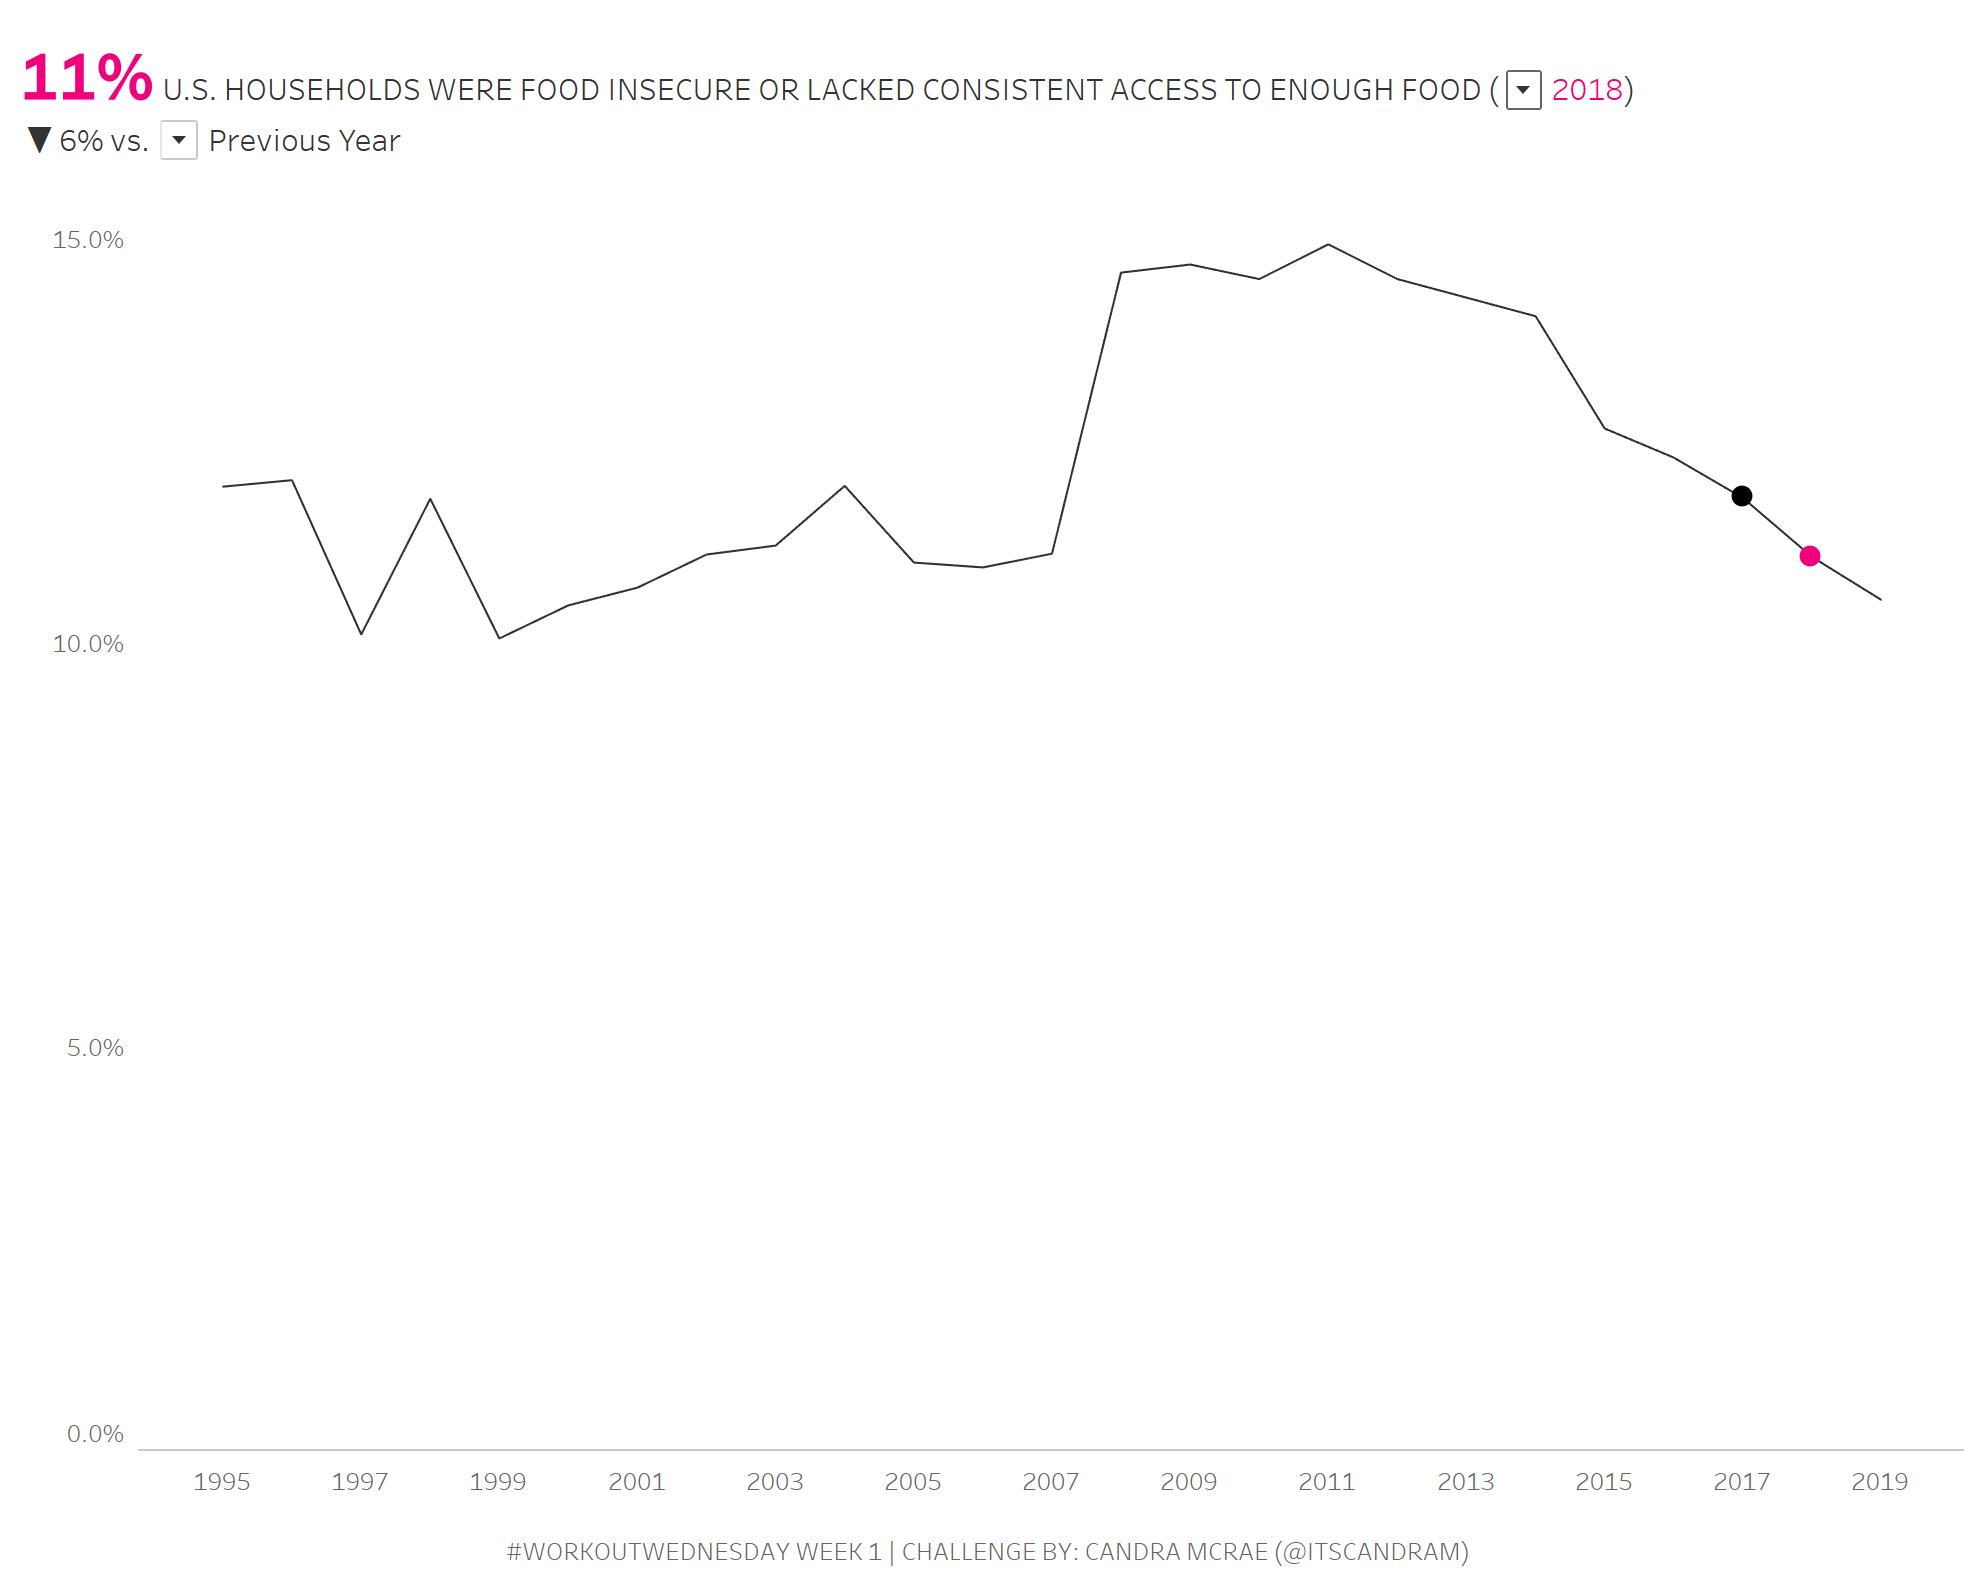
- Create a line chart that trends the food insecurity rate in the U.S. by year that also features circle marks that reflect the year the user selected and the comparison year
- Build functionality that allows the user to toggle between what year they want to focus on and what type of comparisons they would like to make
- Most Recent Year in the data set (in this case, 2019)
- First Year in the data set (in this case, 1995)
- Previous Year (Selected Year -1)
Hint: LOOKUP…it’s a bird, it’s a plane…it’s the first Workout Wednesday of 2021!
Dataset
This week uses the Trends on the Prevalence of Food Insecurity in U.S. Households data set published the USDA. You can get it here at data.world
Attribute
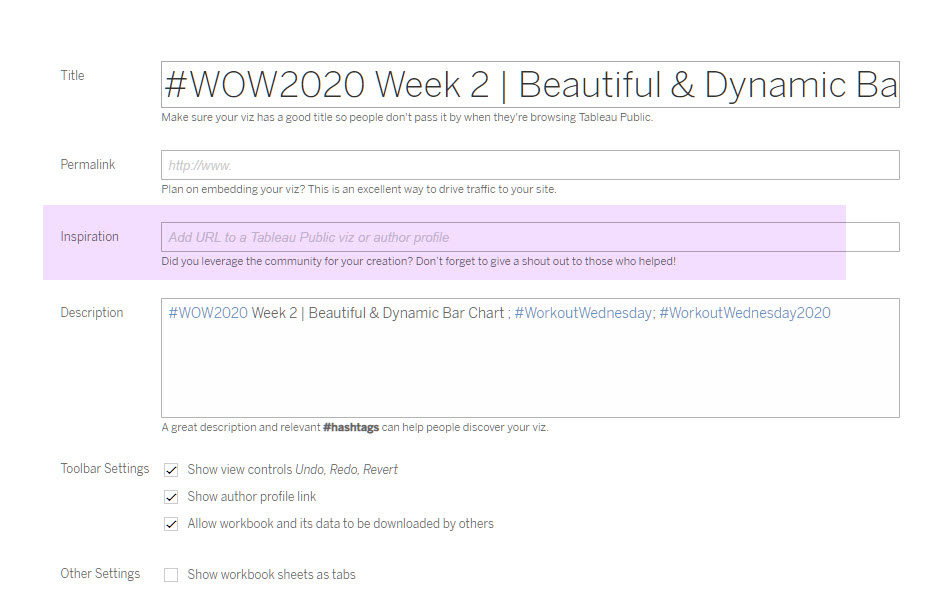
When you publish your solution on Tableau Public make sure to take the time and include a link to the original inspiration. Also include the hashtag #WOW2021 in your description to make it searchable!
Share
After you finish your workout, share on Twitter using the hashtag #WOW2021 and tag @AnnUJackson, @LukeStanke, @_Lorna_Brown, @ItsCandraM, and @HipsterVizNinja
Solution
Interactive