2021 Week 1 | Power BI: Connecting To & Modeling Data

Introduction

Hey all! Thank you so much for checking out the new Power BI edition of #WorkoutWednesday. Although the Tableau version of #WorkoutWednesday has been going on for several years, this is our first attempt at creating a similar community with Power BI. If you’re unfamiliar with the concept, we will release a challenge every week on Tuesday evening. The challenge will consist of a data set, a set of requirements, and eventually a solution video. The hope is that you will take the data set and fulfill all of the requirements in the blog post (such as you’re reading now). The goal is to highlight new techniques, common workarounds, and to generally expand your skillset. No need to delay any further, let’s hop right into it!

Requirements

  • Because this is the first ever #WorkoutWednesday Power BI style, we are going to start simple. The first few challenges are going to build on one another, so keep this in mind as we start out the year. 
  • Create cleaned data set with only teams from the Football Bowl Division. In order to do this, in the FBS Conferences field exclude the FBA Totals and null values.
  • Within NCAA Subdivision, remove all Conference Medians
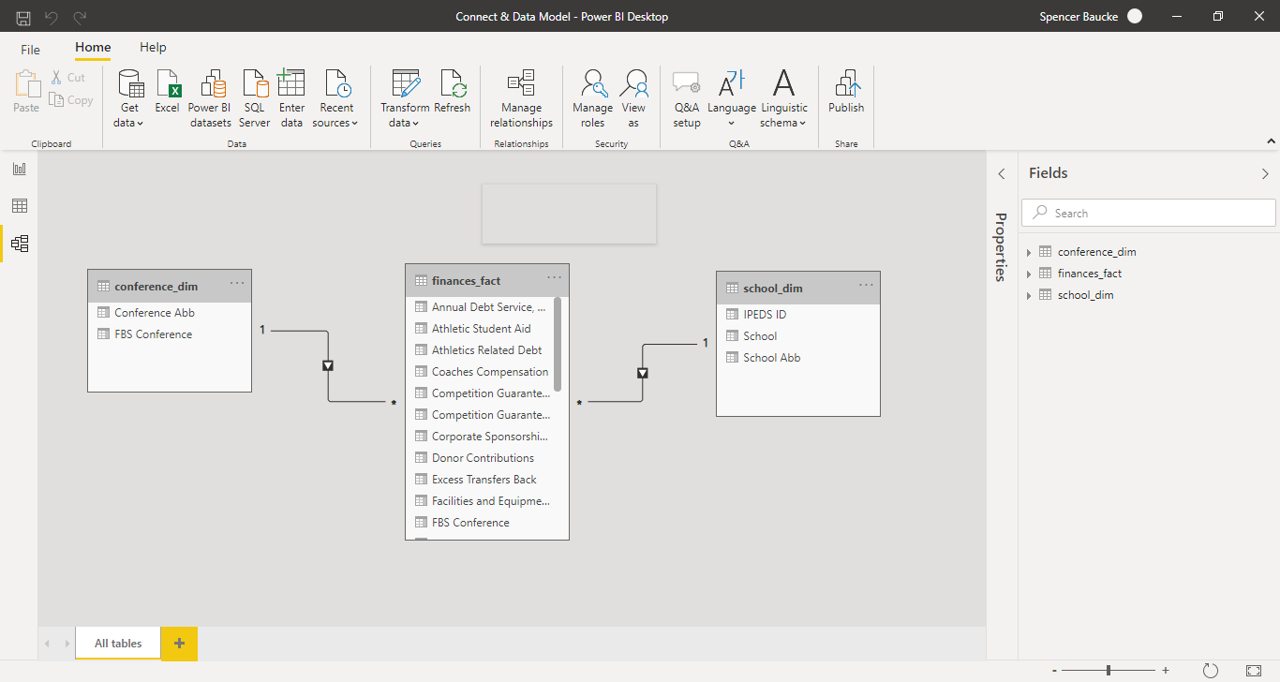
  • Create data model properly relating two dim tables to the fact table. 
  • Try and use as least amount of steps as possible.

Dataset

This week uses a data set that breaks down NCAA athletic department expenses and revenues by year. You can get it here at data.world

Share

After you finish your workout, share on Twitter using the hashtags #WOW2021 and #PowerBI, and tag @JSBaucke@MMarie, @shan_gsd and @dataveldAlso make sure to fill out the Submission Tracker so that we can count you as a participant this week in order to track our participation throughout the year. 

Solution

*As an addition, remove Conference Median values from the NCAA Subdivisions

21 thoughts on “2021 Week 1 | Power BI: Connecting To & Modeling Data”

  1. Christopher Majka

    Hi Spencer – Looking forward to joining the #WOW2020 for Power BI. Thanks for doing this. I may be wrong, but I didn’t think you can fold queries that are excel or .csv files?

  2. Everett E Jackson

    I plugged into the website directly and Native query is grayed out. I am pretty sure if its grayed out, then it isn’t functioning. “How do I Know if Query Folding is Active?
    When you use Power Query, the steps you produce are listed in the right side “applied steps” panel. You can check if a query step has generated query folding (or not) by checking for the existence of Native Query code inside that step. To do this, right-click on one of the query steps and then select “view Native Query”. If you are able to do this, ie if view Native Query is enabled, it means Power Query has successfully performed query folding.”https://exceleratorbi.com.au/how-query-folding-works/

  3. Can you identify where in the solution you did “Within NCAA Subdivision, remove all Conference Medians”? Thank you.

  4. Hey Spencer.. thankyou so much for this initiative. I have been thinking of trying PowerBI for sometime now. This is super helpful. Just wanted to ask one thing. When you open the excel spreadsheet in power query, all the columns show basic descriptive stats for you. It’s not the case for me. How do I turn that on?

  5. Hi,
    It appears that the + Watch feature is not accessible with Edge or Explorer. It does appear when using Chrome. You may want to put a note in the + Watch area stating that Chrome or something other than an MS browser is required to view the solution.
    Thanks for a great resource.
    Larry

  6. I am late to the party but will be serious about PowerBI challenges. Really appreciate the efforts by the moderators

  7. You are saying “After you finish your workout, share on Twitter using the hashtags #WOW2021”. I have Twitter account and I am using Power BI Desktop. What steps do I need to follow to have it published? I googled it but still don’t know how to “publish it”.

    Thanks,
    Zula

    1. Hi, Zula. You can just post to twitter using the two hashtags (#PowerBI and #WoW2021) and include a screenshot of your report PBI desktop. If you don’t have a PowerBI.com account, you can create a developer account here: https://developer.microsoft.com/en-us/microsoft-365/dev-program. But that is entirely optional. If you have a Power BI tenant where you can publish and create a publish to web link, then you can share the link and others can interact with your report. But screenshots are also fine.

  8. I found the video here.
    https://www.youtube.com/watch?v=oiLuV0wBdTE
    Since yesterday the https registration is no longer current for the site.
    I can click through the danger warning but I can’t see the video on Chrome (but could on Tor). I guess that will be fixed when you get back from Independence Day long weekend.

  9. Hi
    Actually I pretty sure about power Bi but I made some mistakes so doing this project I will overcome and hope for good result for my upcoming projects

  10. I just found this website and I am loving this content it really does assist a lot in learning Power BI even in 2023.

Leave a Comment

Your email address will not be published. Required fields are marked *

Scroll to Top