September 2021 is community month. Every year since 2018 we’ve invited individuals to share challenges with the community. This year we’ll have some amazing challenges from the Tableau and Power BI communities.
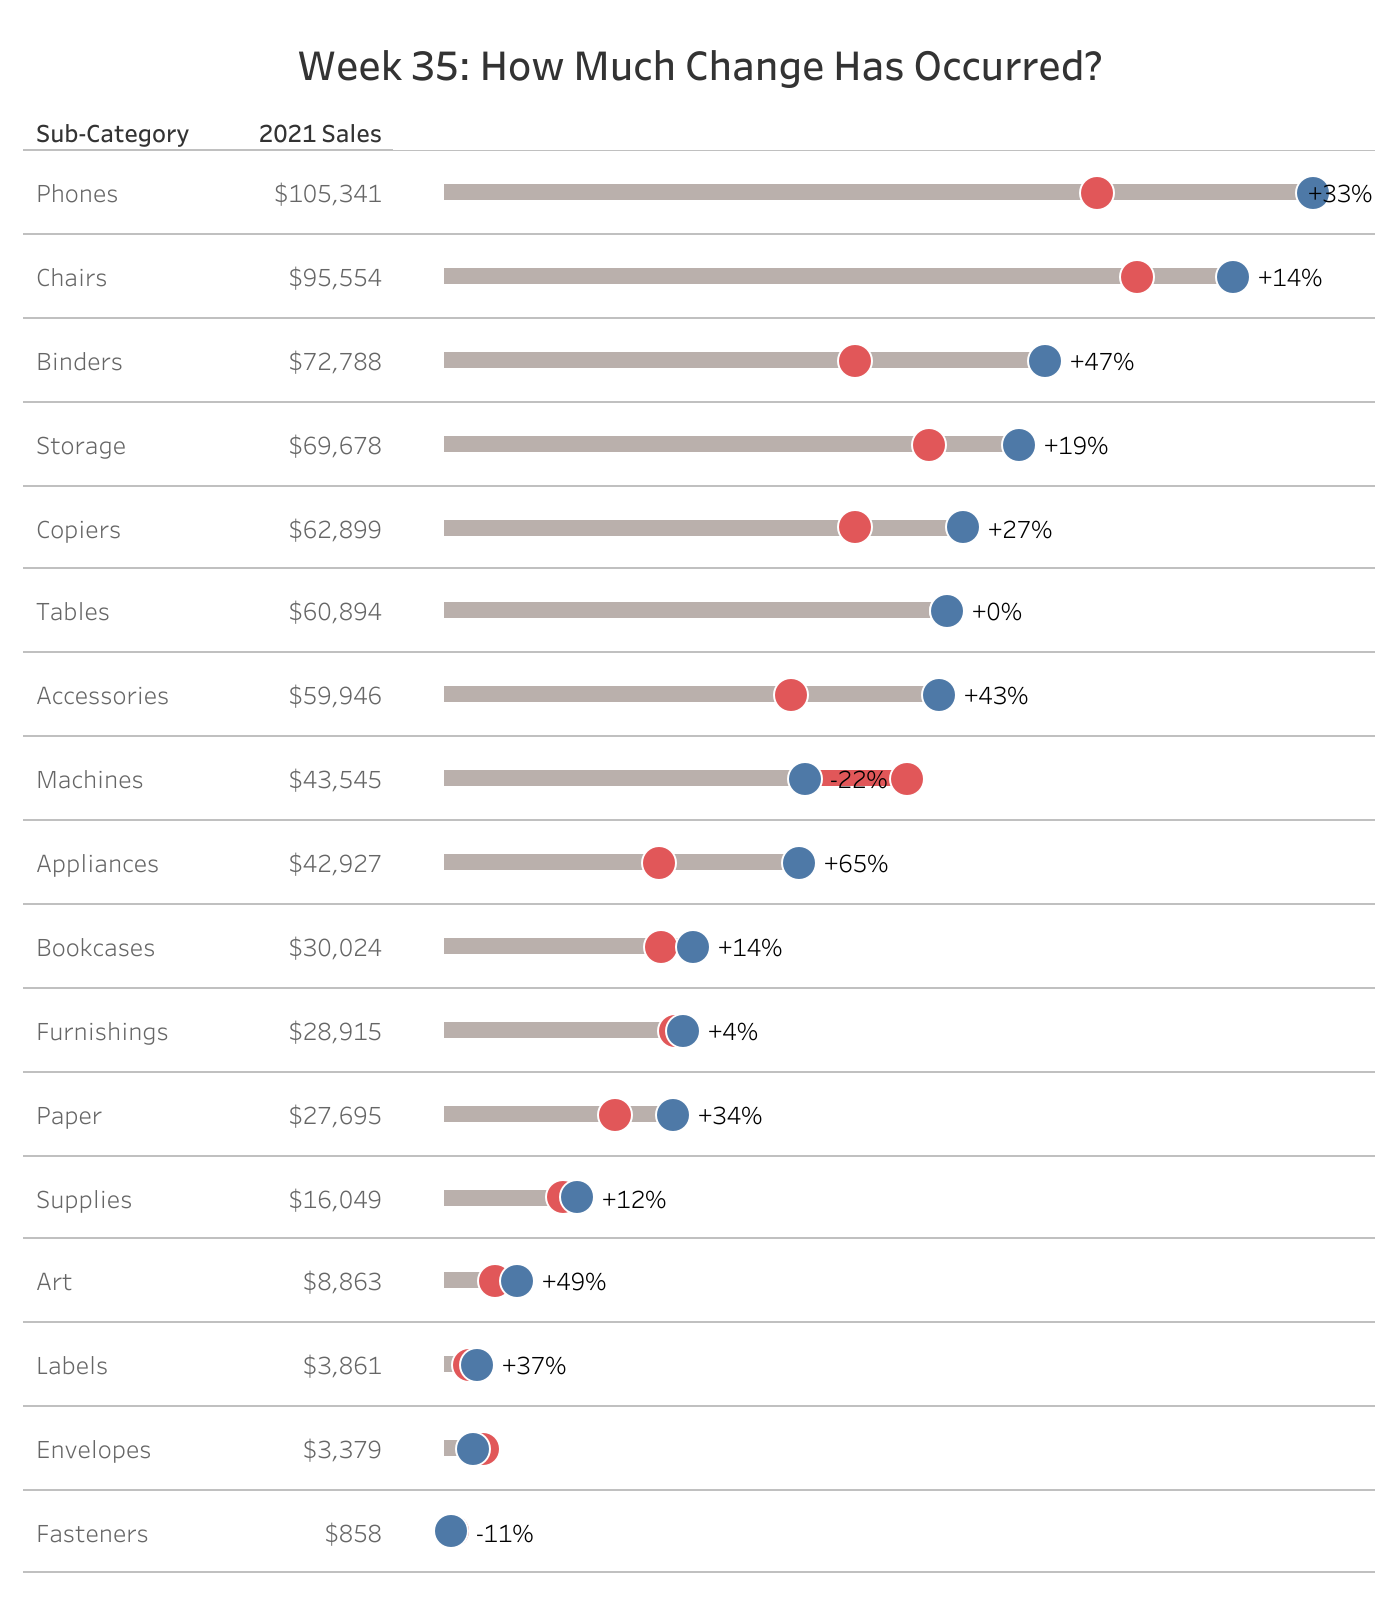
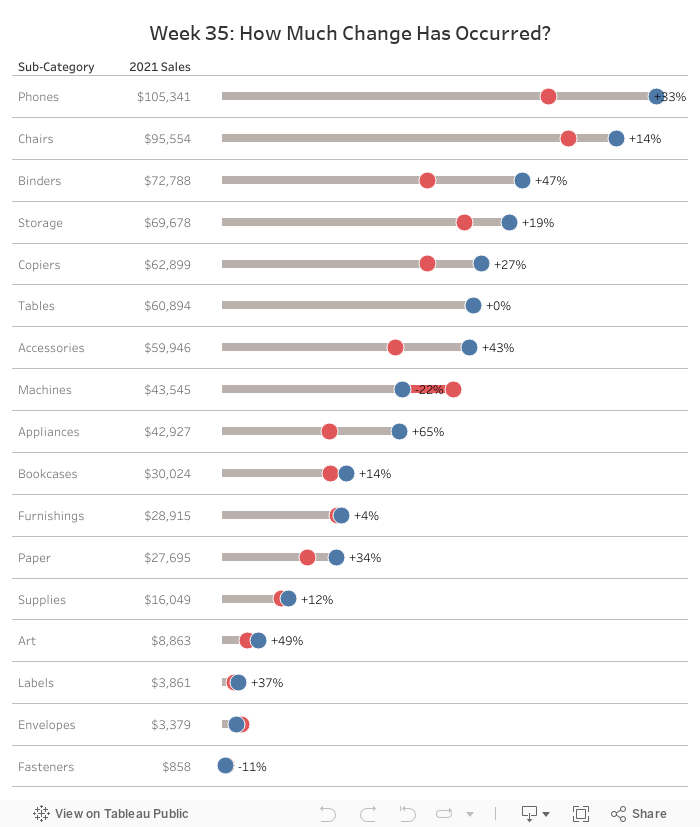
But before we get there I’ll be sharing the following challenge: We’ll make a modified dot plot comparing sales for the current year (2021) with the prior year (2020).
I like using this view as an alternative to bar-on-bar charts.
Show Sub-Category and total sales for 2021 in the header
Label the year over year change on the 2021 dot.
Match formatting
Dataset
This week uses the superstore dataset for Tableau 2021.1. You can get it here at data.world
Attribute
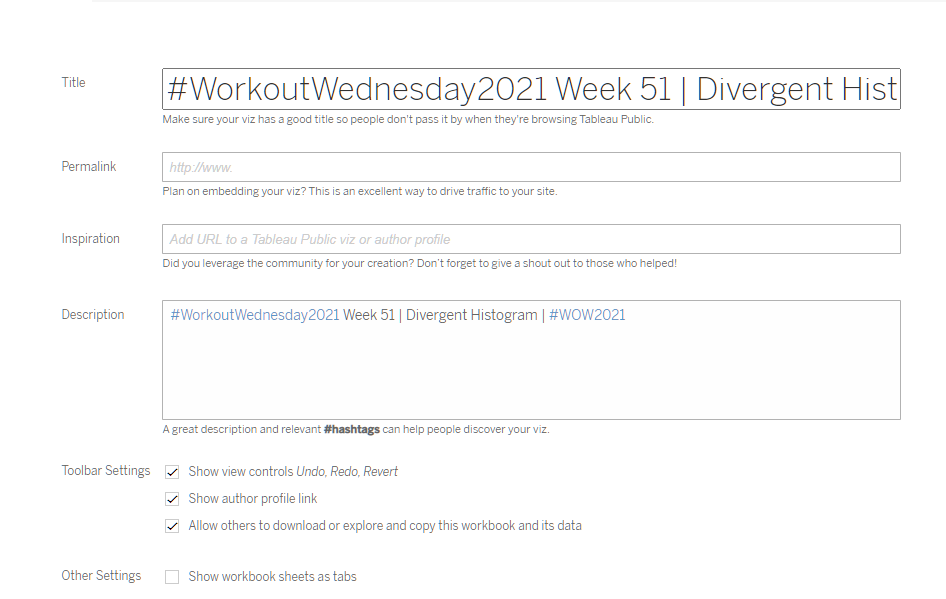
When you publish your solution on Tableau Public make sure to take the time and include a link to the original inspiration. Also include the hashtag #WOW2021 in your description to make it searchable!