Introduction
I hope everyone is continuing to stay safe and sane during this time.
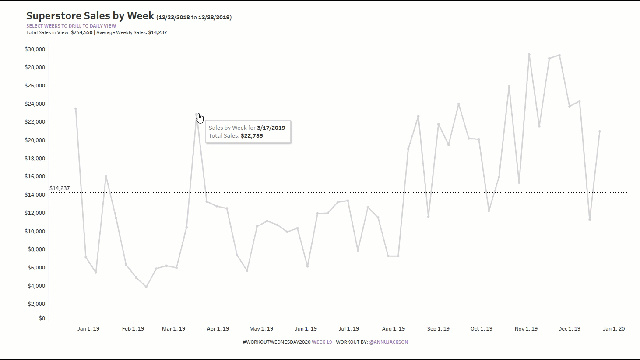
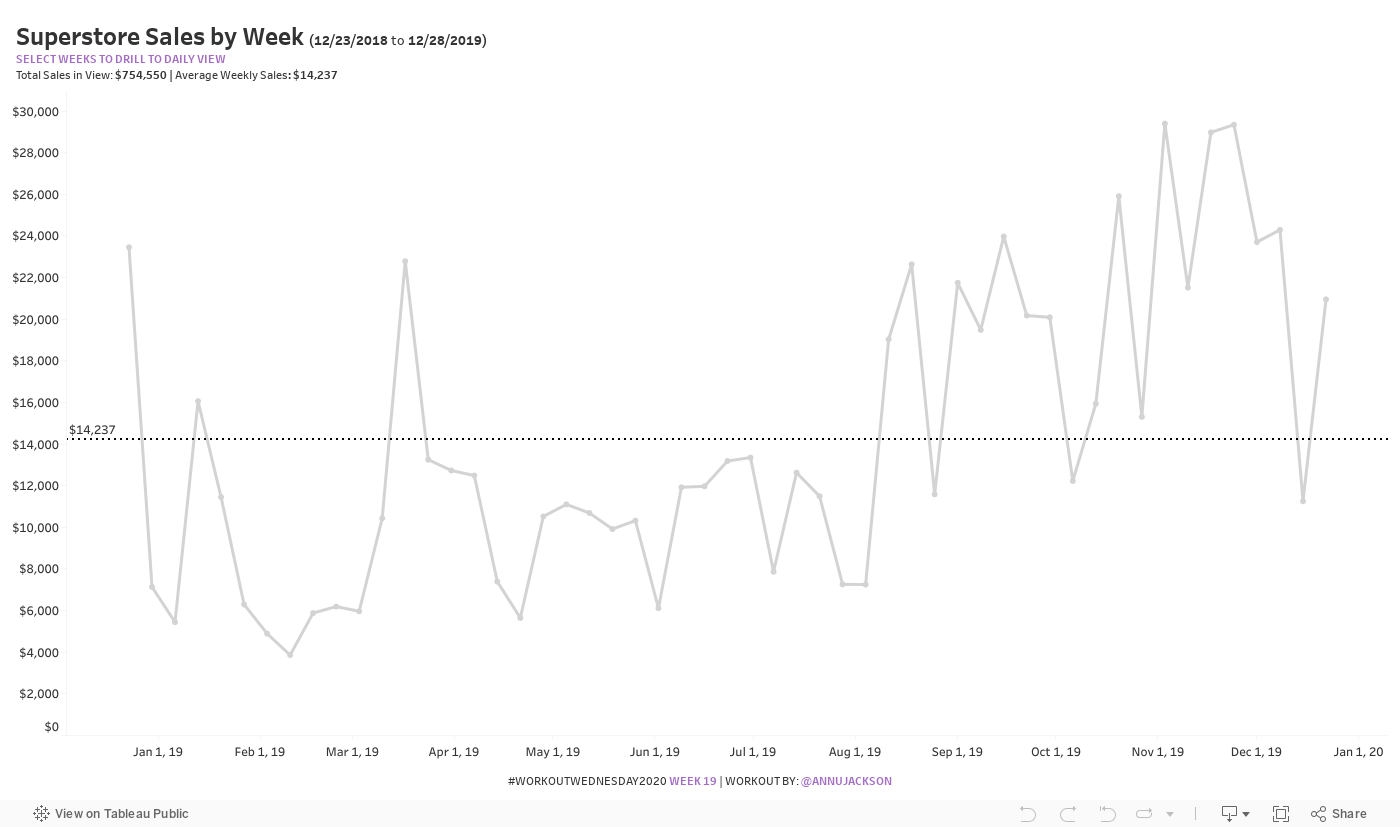
Our challenge for the week is to work with dates again! This one comes from a recent experience I had – the idea is pretty simple, you start your process by looking at more aggregated data, then you want to drill in on a specific time period and see a more detailed picture.
Normally in Tableau I would accomplish this by allowing the date hierarchy to work its magic, but often if you think about that drilling experience you end up with more data than anticipated and it’s not very intuitive.
So this week I’ve re-imagined what the drillable experience could be like for dates – now the user just draws a box over the dates they want to look at in more detail and the chart is responsive. It even has extra intuitive elements added to it: dynamic titles, labels, text, and most importantly – if a user draws a box over two marks and they’ve missed one or two in-between, they’ll still be included in the drill down. This is especially handy if it’s hard to draw a selection box, or there are major peaks and valleys in the trend.
This week’s challenge also includes animations – which give the visualization even more clarity that the user’s input causes a response.
Requirements
- Dashboard Size: 1400 px by 800 px
- # of Sheets – maximum of 2
- Create a line chart that switches from weekly to daily and filters the view based on the dates selected
- When the user selects a time period, it should include everything in between (ex: they highlight 4 marks, but there are 6.. even those 2 they missed should be included)
- Create a button that shows up and allows the user to clear the selection
- Create dynamic titling for the chart that changes based on how the user is interacting
- Create an average line, average value, and total sales value
- Match any additional formatting/tooltips
- For simplicity, the data has been hard-code filtered to the last 53 (Thanks Ann S.!) weeks – feel free to spend some time making that filter
Dataset
This week uses the superstore dataset for Tableau 2019.4. You can get it here at data.world
Attribute
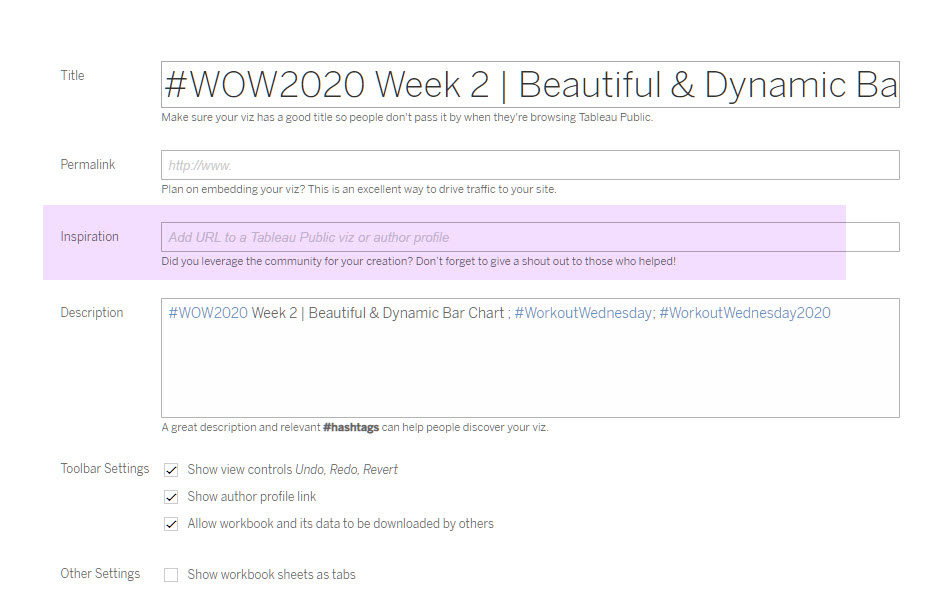
When you publish your solution on Tableau Public make sure to take the time and include a link to the original inspiration. Also include the hashtag #WOW2020 in your description to make it searchable!
Share
After you finish your workout, share on Twitter using the hashtag #WOW2020 and tag @AnnUJackson, @LukeStanke, @_Lorna_Brown and @LosaniMeera
Solution
Interactive
Thanks Ann! As awesome as usual. The interaction with the Clear Selection Button was difficult to manage though.