2020 Week 34: Can you show all the crimes within X miles of Y Point?
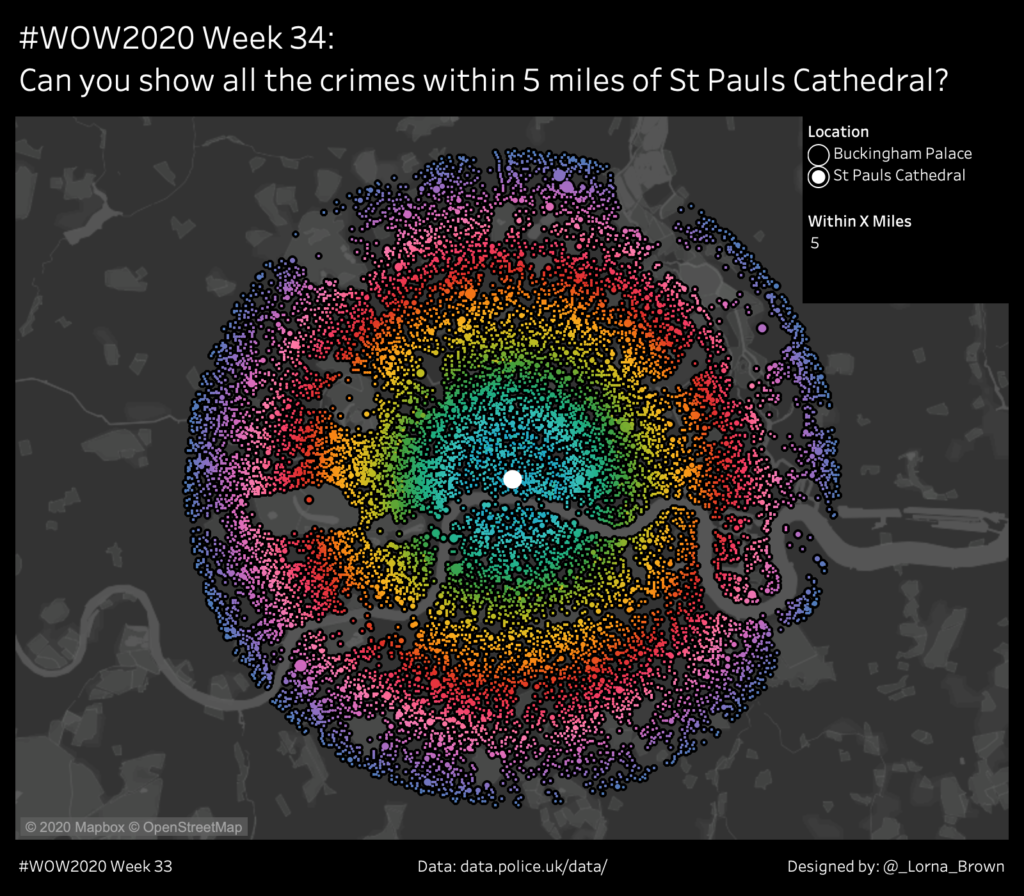
Introduction This week, I thought I would do a throwback to a speed tipping session I did in Vegas at Data19. This is using some of the cool spatial techniques. I like to think of this as a target chart, as that’s what it creates. Click to open in Tableau Public Requirements Dashboard Size: 800px […]
2020 Week 34: Can you show all the crimes within X miles of Y Point? Read More »
Tableau, Workout Wednesday