KPI

2026 Week 04 | Sigma: Can you Make a Repeating Container?

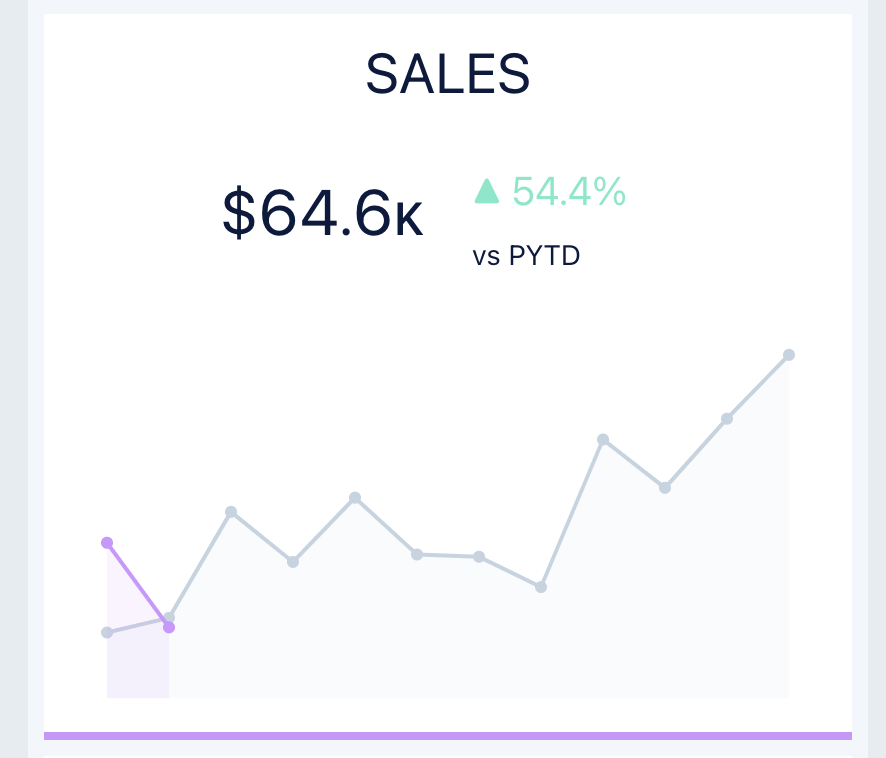
Introduction This week’s challenge features the new Repeating Container element, which is a powerful new visual that can display feed-like information quickly and easily. Today, I want to show you how you can use this feature to make more detailed KPI-like cards in your workbooks. This feature is still in beta – are there any things […]

2026 Week 04 | Sigma: Can you Make a Repeating Container? Read More »

Week 38: Can you build a sales comparison chart with performance indicators?

This week I’m tackling a topic that nearly everyone has been asked – visualizing good/bad as performance indicators that are red or green.  At least here in the western world, the busy executive tends to think about things in terms of traffic lights.  So this week your task is to create something that satisfies their

Week 38: Can you build a sales comparison chart with performance indicators? Read More »