Beginner

2023 Week 08 | Power BI: Create an interactive resume

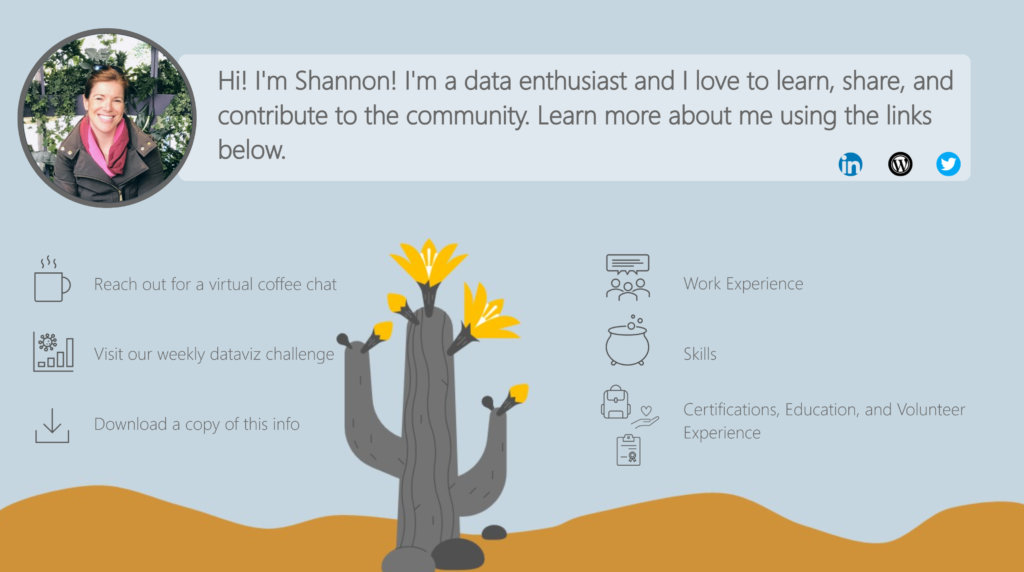
Introduction Welcome back to Workout Wednesday! This week we will use Power BI to build an interactive resume. This challenge is for a few different audiences. 1) Job seekers – feel free to use this template, plug in your information, make design tweaks, and post this to your portfolio! 2) Data vizzers – use the starter […]

2023 Week 08 | Power BI: Create an interactive resume Read More »

Power BI, Workout Wednesday

2023 Week 05 | Power BI: Visualize the Oscars with an Isotype/Pictogram Chart

Introduction Hello and welcome back to Workout Wednesday! If you’re joining us for the first time, be sure to check out our complete list of challenges. This week we’re looking at data from the American Academy Awards, also known as the Oscars. The Oscars are awards for artistic and technical merit for the American film industry

2023 Week 05 | Power BI: Visualize the Oscars with an Isotype/Pictogram Chart Read More »

Power BI
Power BI page featuring an image carousel

2022 Week 52 | Power BI: Image Carousel

Introduction “Hot days, warm nights, beaches, backyard cricket and Christmas celebrations are all part of summer in the Southern Hemisphere.” This week we will be connecting to a public flickr photo gallery from the State Library of South Australia, to create an image carousel using a custom visual from AppSource. Requirements Power Query Connect to the

2022 Week 52 | Power BI: Image Carousel Read More »

Power BI, Workout Wednesday

2022 Week 49 | Power BI: Build a Holiday Song Picker

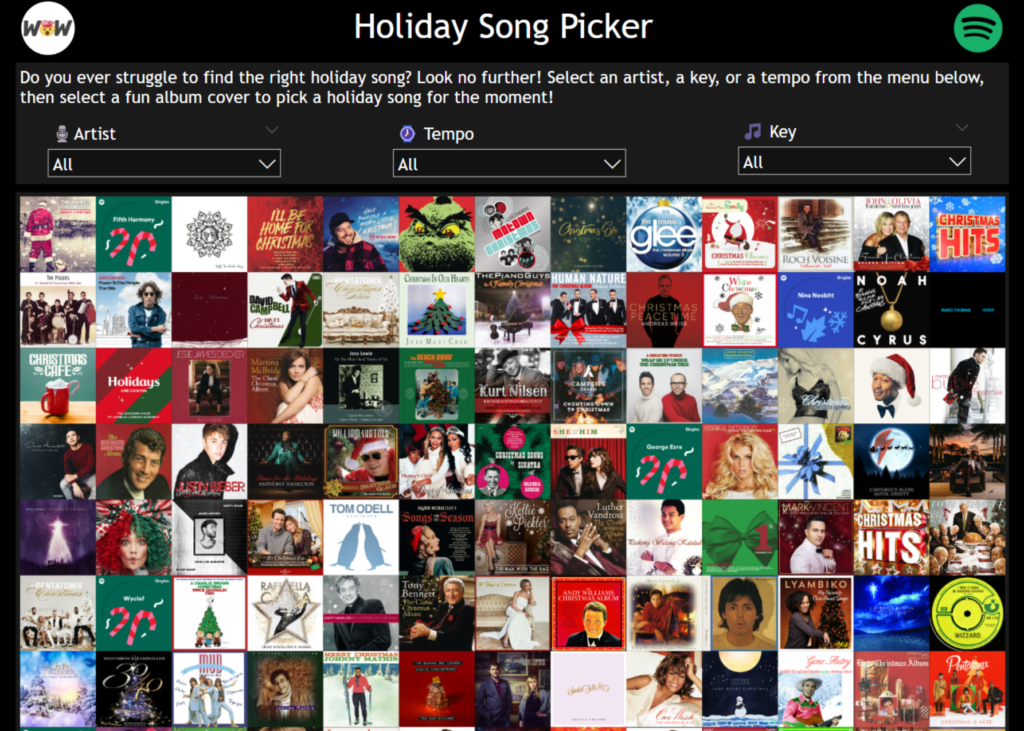
Introduction Welcome back to Workout Wednesday 2022! This week we’re continuing our work with images and building a fun Holiday Song Picker using the Image Grid custom visual in Power BI! We’ll use data from Spotify to help select a song based on Artist, Tempo, or Key. If you’d like to follow along with the

2022 Week 49 | Power BI: Build a Holiday Song Picker Read More »

Power BI, Workout Wednesday

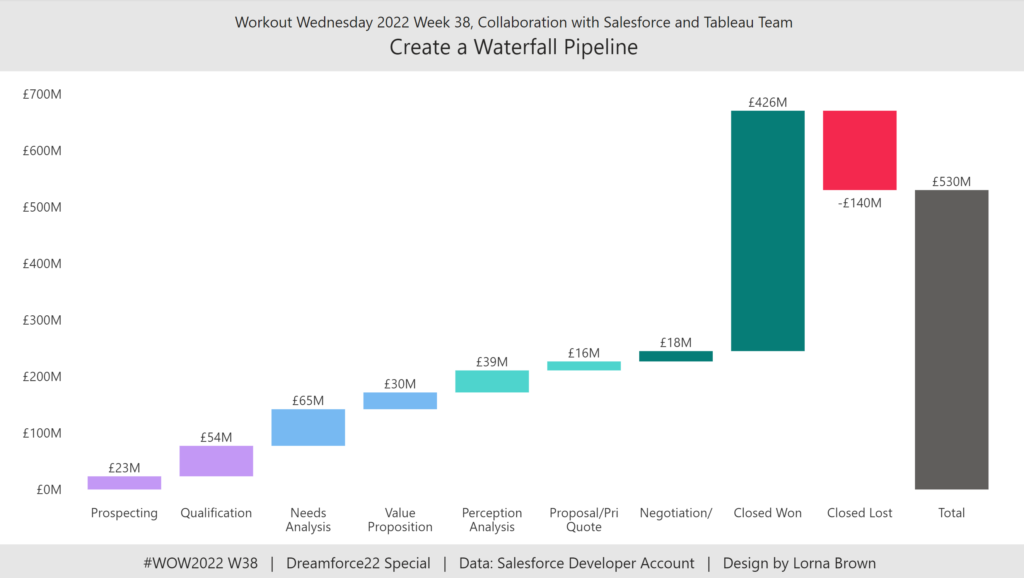
2022 Week 38 | Power BI: Create a Waterfall Pipeline

Introduction Welcome back to Workout Wednesday! This week we’re collaborating with the Tableau team to create a waterfall pipeline using Salesforce data. Lorna Brown, the creator of the challenge is attending Saleforce’s Dreamforce conference, hence the nature of the challenge. We’re building a waterfall chart using the Simple Waterfall custom visual by Datanomy Limited. This week’s workout can be done in

2022 Week 38 | Power BI: Create a Waterfall Pipeline Read More »

Power BI, Workout Wednesday

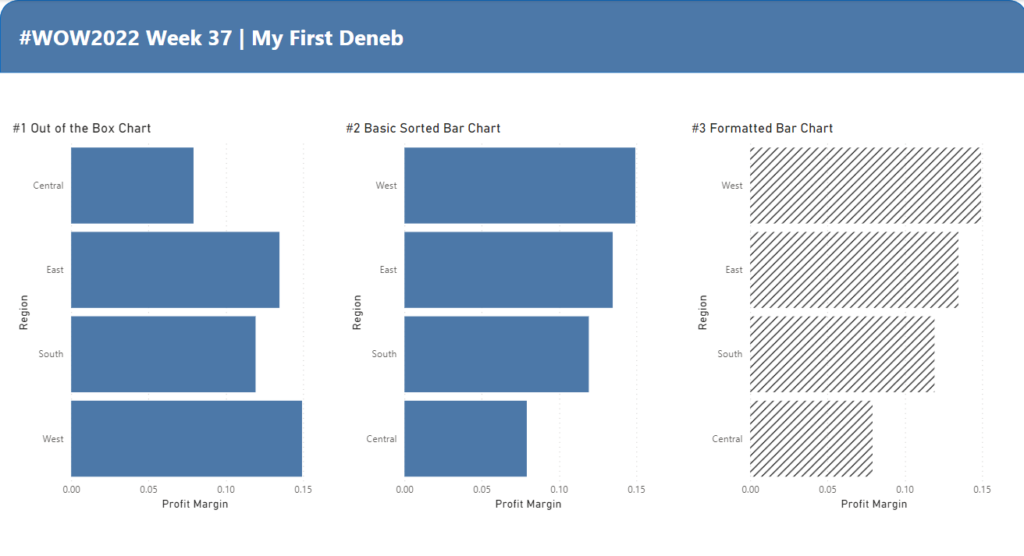
2022 Week 37 | Power BI: My First Deneb

Introduction I sit back every week and watch the other amazing members of the #WorkoutWednesday Power BI team go through Deneb challenges like it’s nothing. The visuals are fantastic, the customizations are intriguing, but the truth is – I’ve never done a Deneb visual! Until this week that is.    If you’re like me and

2022 Week 37 | Power BI: My First Deneb Read More »

Power BI, Workout Wednesday

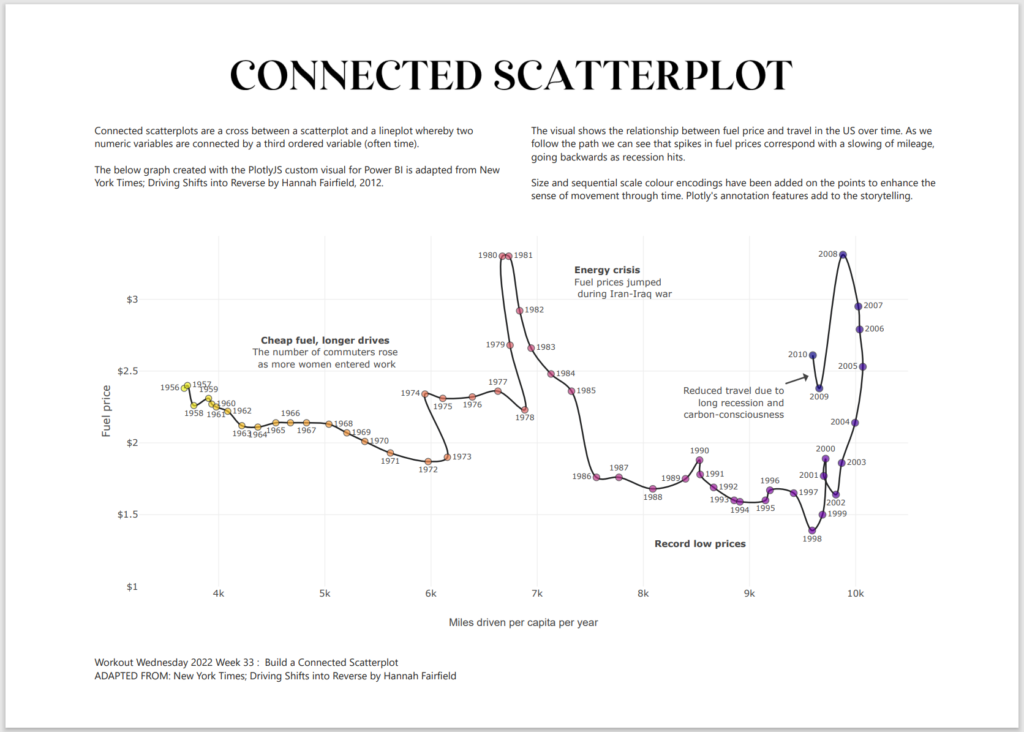
2022 Week 31 | Power BI: Connected Scatter with PlotlyJS

Introduction This week for Workout Wednesday we are getting familiar with the PlotlyJS visual by creating traces and annotations for a connected scatterplot.   Connected scatterplots are a cross between a scatterplot and a lineplot whereby two numeric variables are connected by a third ordered variable (often time).   The below graph created with the

2022 Week 31 | Power BI: Connected Scatter with PlotlyJS Read More »

Power BI, Workout Wednesday

2022 Week 28 | Power BI: Error Bars

Introduction Welcome back to Workout Wednesday! If you’re joining us for the first time, welcome! We present you with a challenge, a dataset to recreate the challenge, and a solution video or file. You can use these challenges to build your skills and your portfolio! This week we’re exploring the error bars feature in Power

2022 Week 28 | Power BI: Error Bars Read More »

Power BI, Workout Wednesday