Workout Wednesday

Week 41: Top & Bottom Highlights

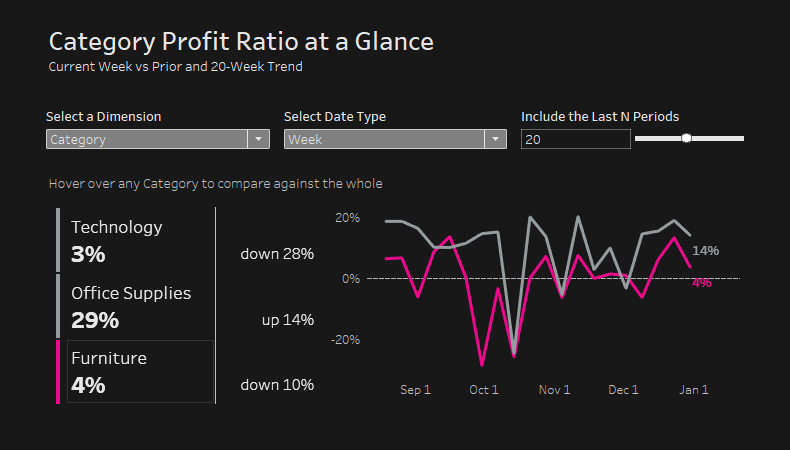
This week’s workout is designed for the end user looking for immediate insight – think of an executive stakeholder or someone more drawn to quickly getting numbers and results.ย  These folks don’t necessarily have the time to look deeper into the details, but are still craving data in context. To satisfy their requests you’ll be

Week 41: Top & Bottom Highlights Read More ยป

Tableau, Workout Wednesday

WEEK 39: VERTICAL LABEL AND 3 MARKS

Hello Again! This week I am back with a fairly simple challenge, but one that has a few (I believe) useful tricks that could help spice up your next viz. The tricks used here are geared toward design, but have additional benefits. Requirements: Dashboard size: 1000 x 800 Create a Parameters for metrics Sales|Profit|Quantity Create

WEEK 39: VERTICAL LABEL AND 3 MARKS Read More ยป

Tableau, Workout Wednesday

Week 37: Recreating Paying the President

Challenge This week we’ve partnered with Makeover Monday to examine potential conflict of interest between President Trump’s personal holdings and his campaign staff and government officials using data from Propublica. We’ll also be giving you a few formulas so you can focus on the important parts of the challenge: “stacking” the squares and placing the

Week 37: Recreating Paying the President Read More ยป

Tableau, Workout Wednesday

Week 35: Superstore Small Multiples

We’re wrapping up our month of Community submissions with a workout submitted by Zen Master Neil Richards.  A great way to end an awesome month facilitated by so many members of the Workout Wednesday community.  We’ve definitely been inspired and challenged by your contributions and impressed with the support you’ve given to those completing your

Week 35: Superstore Small Multiples Read More ยป

Tableau, Workout Wednesday

Week 34: Building an Interactive Display to Visualize Violence in the DRC

This week we’re visualizing conflict data provided by ACLED.  ACLED, which stands for Armed Conflict Location & Event Data Project, is a “disaggregated conflict collection, analysis and crisis mapping project.”  You’ll notice throughout the Tableau Community this week that there are several partner projects going on – all designed to provide awareness on ACLED’s cause. 

Week 34: Building an Interactive Display to Visualize Violence in the DRC Read More ยป

Tableau, Workout Wednesday