Introduction
Lately I’ve been working with Google Analytics data, so I thought I’d pass on a data set to you! Our data set was created by you the audience – it’s extracted directly from our website analytics.
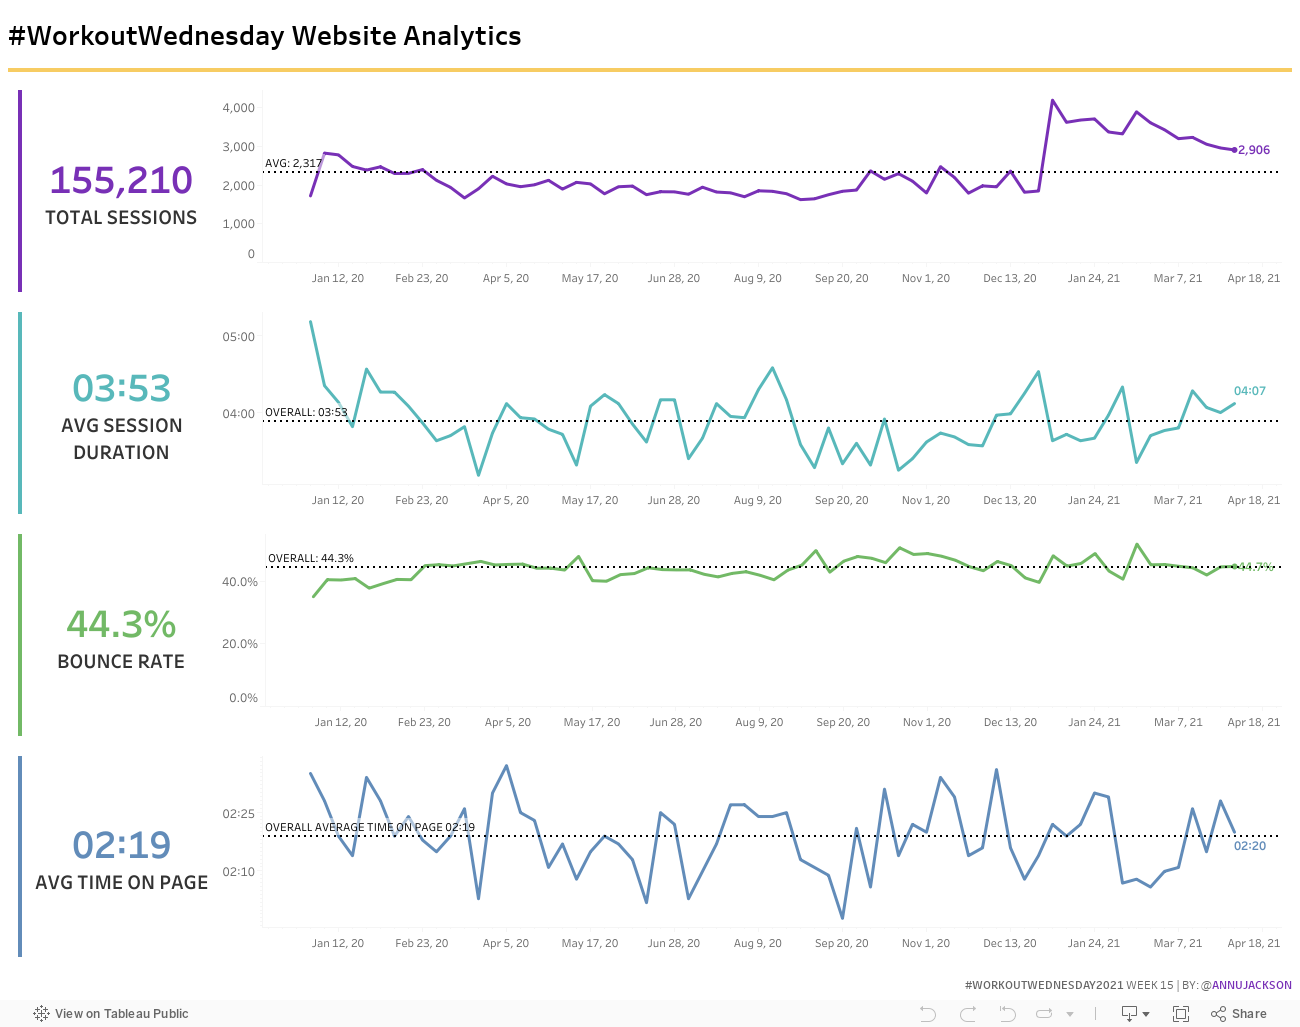
This week’s challenge focuses on a lot of little things coming together – dashboard design, formatting, and reference lines. The big “aha” moment for me in this challenge is working with duration/time in the format of minutes and seconds, most specifically getting the reference lines to display.
Requirements
- Dashboard Size: 1300px by 1000px
- # of Sheets – up to you
- Create 4 Metrics with Trend lines
- Total Sessions
- Trend weekly, with a weekly average reference line
- Average Session Duration (Session Duration/Sessions)
- Trend weekly, with an overall (aggregate) reference line, this must be formatted in minutes and seconds
- Bounce Rate (Bounces/Sessions)
- Trend weekly, with an overall (total) reference line
- Average Time on Page (Time on Page/(Pageviews – Exits))
- Trend weekly, with an overall (aggregate) reference line, this must be formatted in minutes and seconds
- Colors
- Purple: #7830b6
- Green: #72b966
- Yellow: #f7cc63
- Darker Blue: #628cb9
- Lighter Blue: #58b8ba
- Total Sessions
FYI: Since this is a static data set, I’ve filtered it to 12/29/2019 to 4/10/2021
Dataset
This week uses an export from Google Analytics. You can get it here at data.world
You can see full definitions of data set attributes in the GA Dimensions & Metrics Explorer
Attribute
When you publish your solution on Tableau Public make sure to take the time and include a link to the original inspiration. Also include the hashtag #WOW2021 in your description to make it searchable!
Share
After you finish your workout, share on Twitter using the hashtag #WOW2021 and tag @AnnUJackson, @ItsCandraM, @LukeStanke, @_Lorna_Brown and @HipsterVizNinja
Solution
Interactive