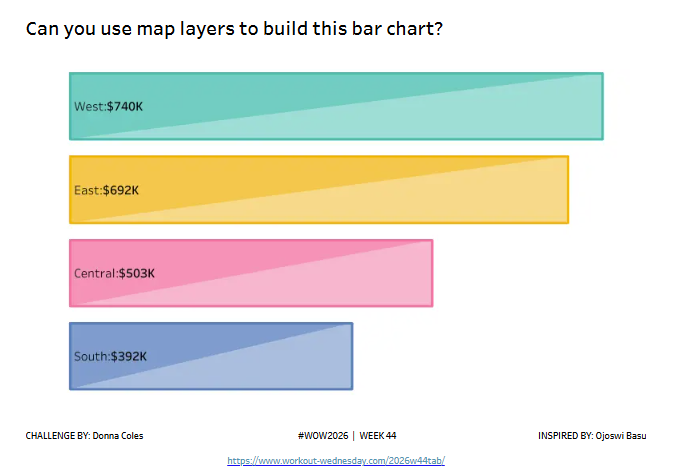
For this week’s challenge, I was inspired by this viz by Ojoswi Basu. I was intrigued by how the shaded bar chart had been built, and wanted to have a go myself, which in turn meant I’d ask everyone else to have a go too 🙂 This is a map layers challenge, so a scaffold data source is provided to help with the build.
Relate the Superstore data with the Points data source provided
Create a bar chart of Sales by Region, sorted by Sales. – the bar should be outlined in a darker shade of the bar colour – the bar should be segmented in half on the diagonal and shaded accordingly – label the bars with the Region and Sales value – clicking on the viz should show result in no noticeable interactivity (no tooltips, no marks selected etc).
Dataset
Uses Superstore data along with an additional scaffold data source here
Attribute
When you publish your solution on Tableau Public make sure to take the time and include a link to the original inspiration. Also include the hashtag #WOW2026 in your description to make it searchable!