
Introduction
Did you watch the Tableau keynote at Dreamforce 2026? I enjoyed it, and there were a lot of big announcements. It also left me thinking about where dashboards fit now. Ad hoc analysis seems to be moving to AI, and we’re somewhere in the middle of that shift. My current view is that dashboards are for delivering the right information at the right time. For some dashboards, that means answering the few questions everyone on the team should know.
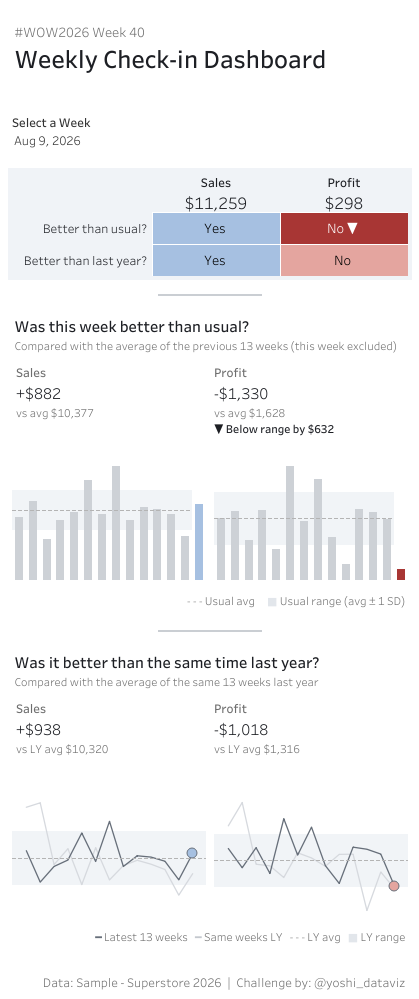
In this challenge, you’ll build one of those. It gives four Yes / No answers, each with a number and a small chart. Weekly numbers can be noisy, so each answer is checked against a normal range instead of just last week. Have fun with it!
Requirements
- Dashboard size: 420 x 1000 px
- Create a parameter to select a week.
- The choices are the 8 week starts (Sundays) from 2026-06-21 to 2026-08-09, and the default is 2026-08-09.
- Below, “this week” means the selected week
- Answer two questions for Sales and for Profit:
- Was this week better than usual? Compare with the 13 weeks before this week
- Was it better than the same time last year? Compare with the 13 weeks ending with this week, shifted back 52 weeks.
- For each comparison:
- Answer Yes if this week is at or above the comparison average, otherwise No
- The range is the average ± 1 sample standard deviation.
- Color by where this week sits, and add ▲ / ▼ to the answers outside the range:
- Above the range: dark blue (#2063b0)
- Inside the range, at or above the average: light blue (#a6c0e1)
- Inside the range, below the average: light red (#e4a59f)
- Below the range: dark red (#a83634)
- Header: the four answers as tiles, with this week’s value for each metric
- KPI cards: the $ gap from the average and the average itself, plus how far this week is past the bound when outside the range
- Bar chart: the previous 13 weeks and this week, with the range and average kept off this week’s bar
- Line chart: this year’s and last year’s 13 weeks, with last year’s range and average
Dataset
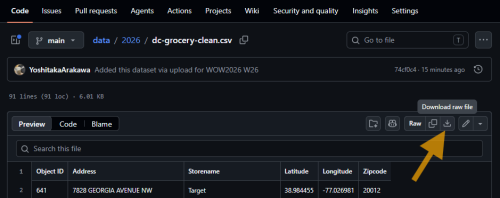
This challenge uses the Sample Superstore 2026.2. You can download the data here (GitHub).
Attribute
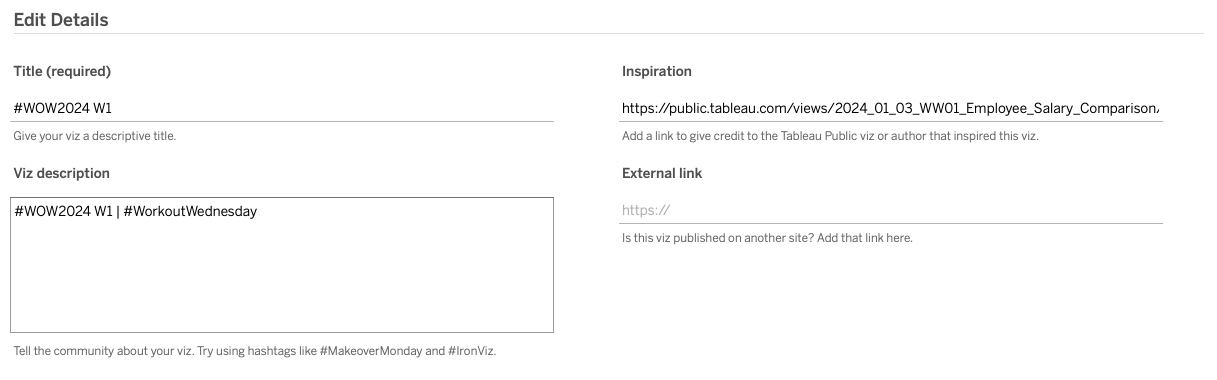
When you publish your solution on Tableau Public make sure to take the time and include a link to the original inspiration. Also include the hashtag #WOW2026 in your description to make it searchable!
Share
- On X using the hashtag #WOW2026 #Tableau and tag @WorkoutWednsday and @yoshi_datavizjp
- On LinkedIn using the tag Workout Wednesday, Tableau, and Yoshitaka Arakawa
Solution
Interactive
