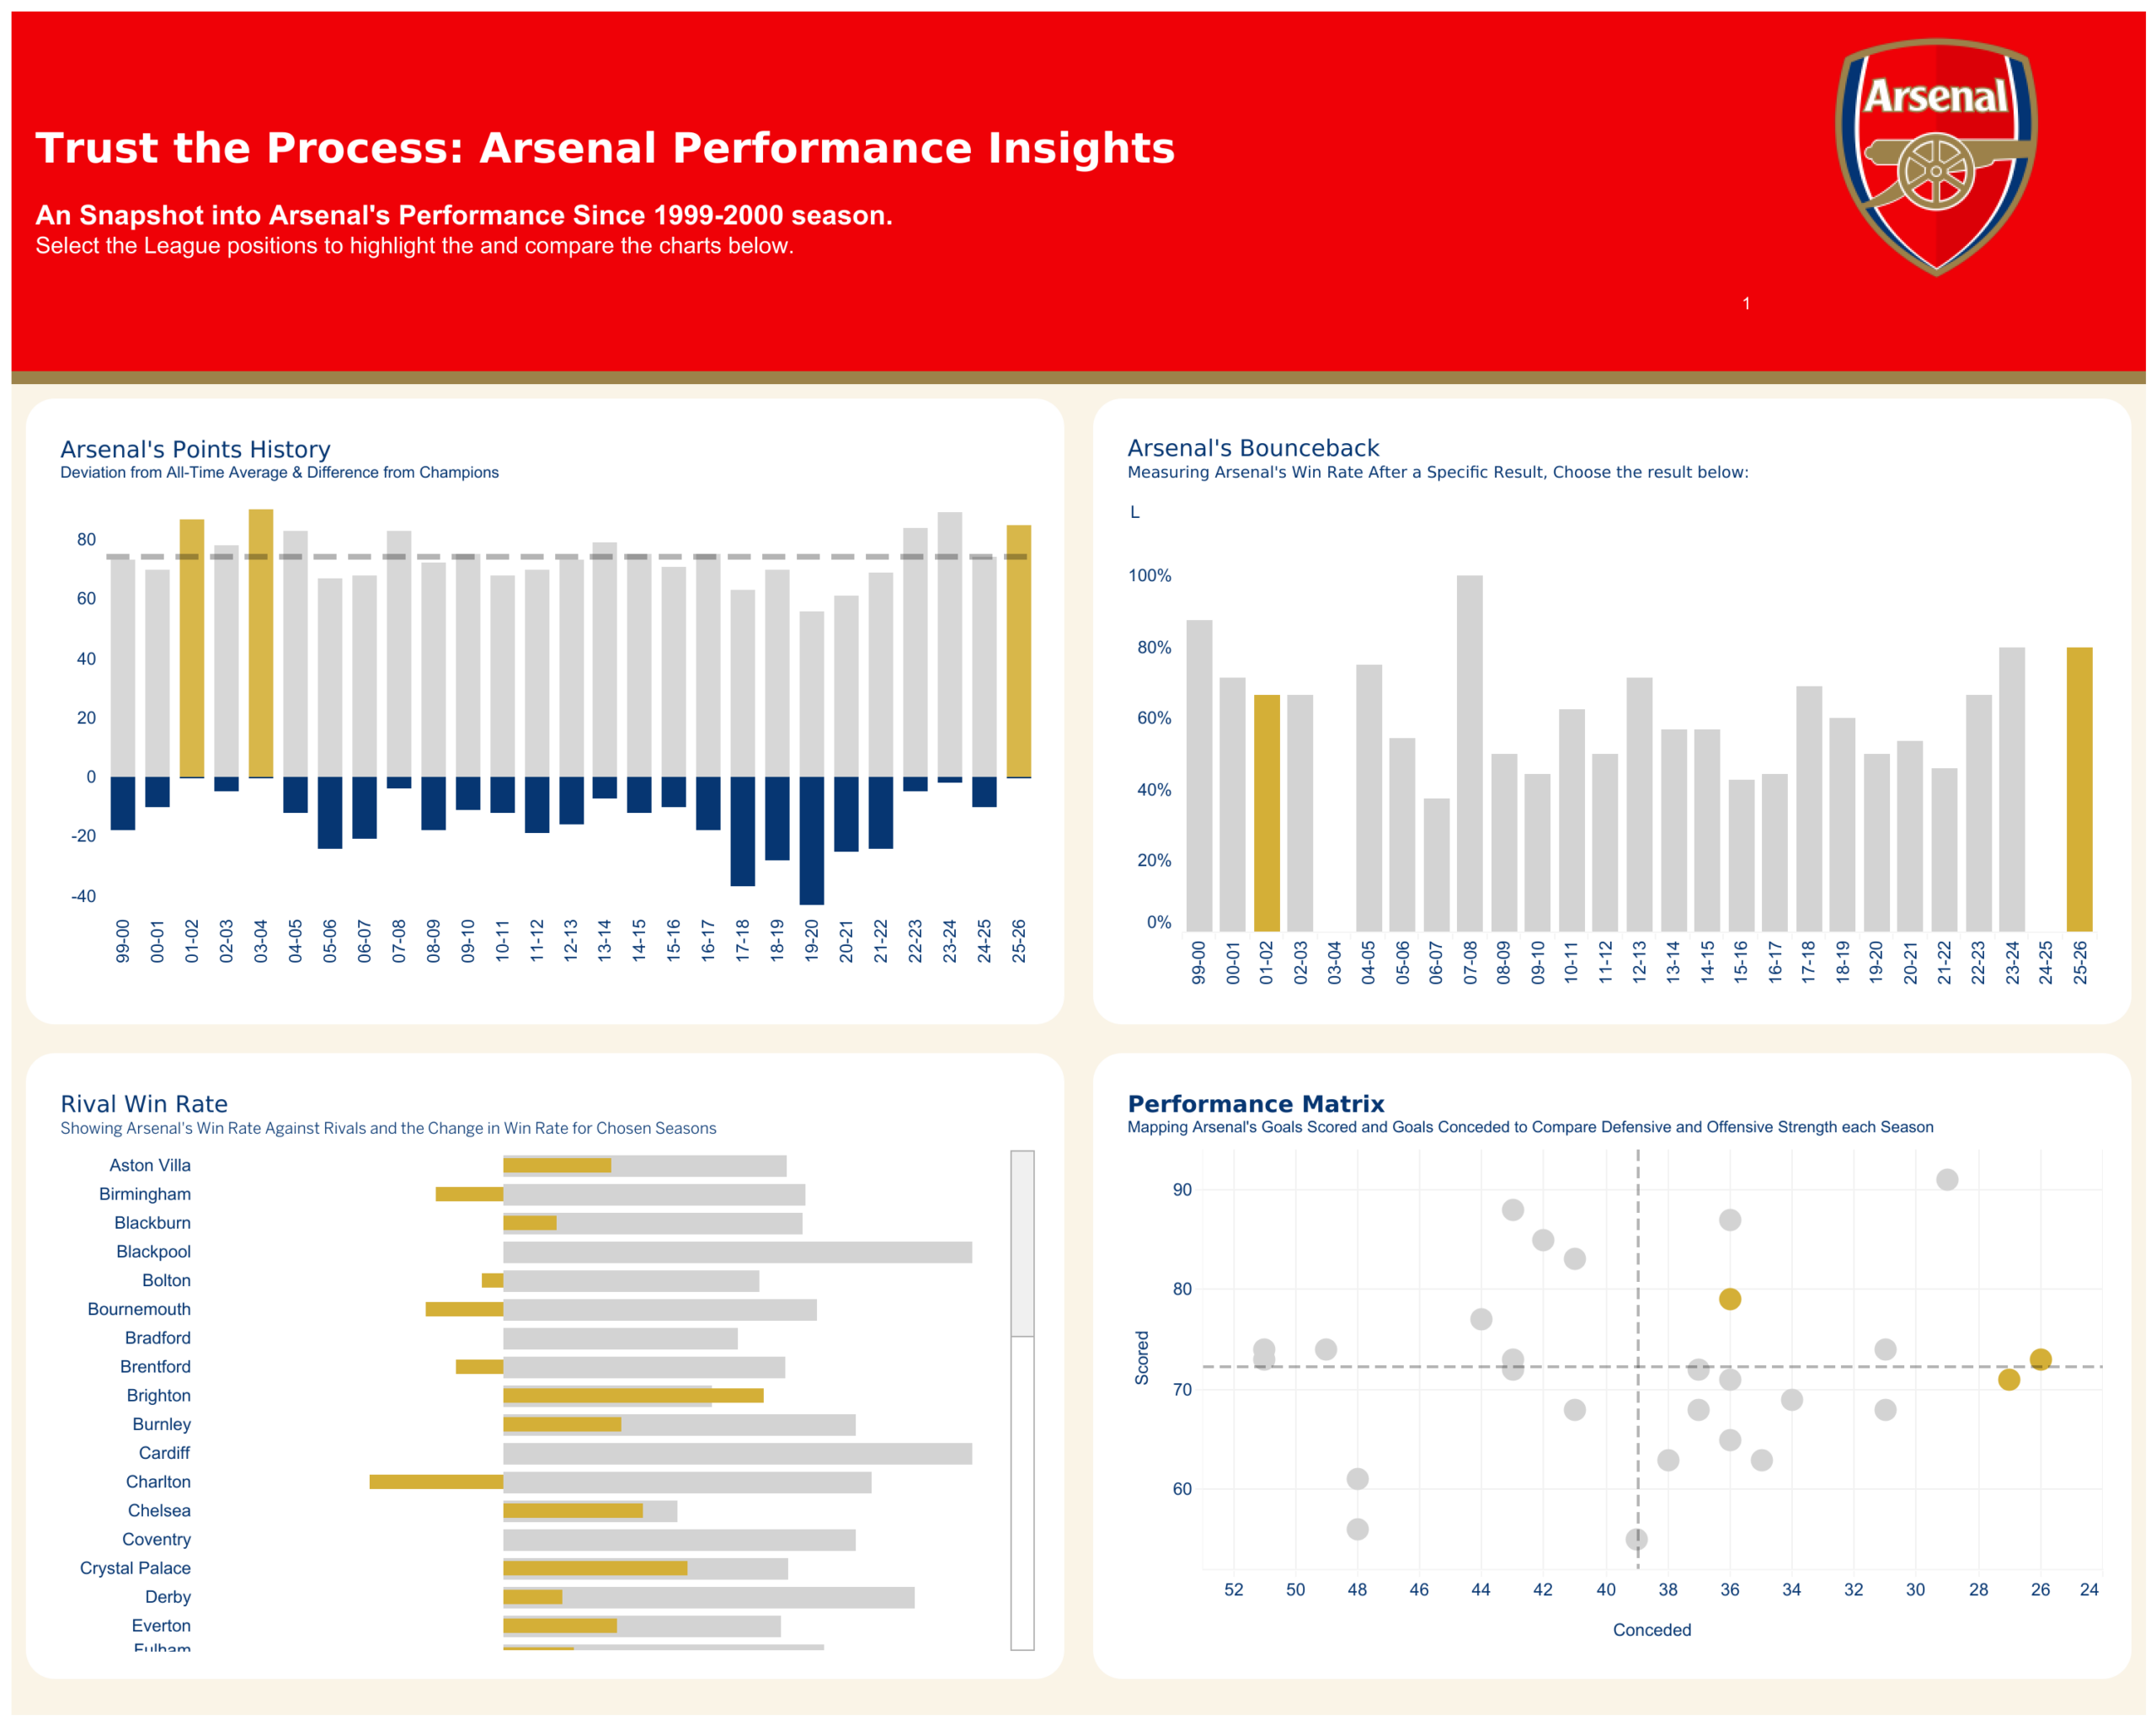
#WOW2026 Week 39: Can you create a comparison dashboard? / Tableau, Workout Wednesday / By Lorna Brown Introduction This week’s challenges comes from another Data School consultant – Elda KetenaElda has created this challenge for a football team to enable comparisons against the top performing team. Enjoy! Click to open in Tableau Public Requirements A user selects the position in the top right of dashboardColour of bars (apart from the chart on the bottom left) should indicate the position that Arsenal came for that seasonDashboard Size: 1500×1200Fixed LODs and Set (no actions just a calculated field on colour)Chart 1:Points / season and the difference between Arsenal and ChampionsChart 2:Win rate after a Loss, after a Draw, and after a win.How likely Arsenal were to win their next game if they had Lost/ Won/ Drew their last one across seasons.Chart 3:Win rate against teams and the yellow bar is their win rate in the years that they finished in the position selected in top right.So if 1st and 2nd are selectedWin rate vs win rate in the years that arsenal came 1st and 2ndChart 4:Goals Scored/Goals Conceded Dataset Requires two datasets:Season LevelGame Level Attribute When you publish your solution on Tableau Public make sure to take the time and include a link to the original inspiration. Also include the hashtag #WOW2026 in your description to make it searchable! Share After you finish your workout, share on Twitter and/or LinkedIn using the hashtag #WOW2026 #Tableau and tag @WorkoutWednsday Solution Watch Read Interactive