
Introduction
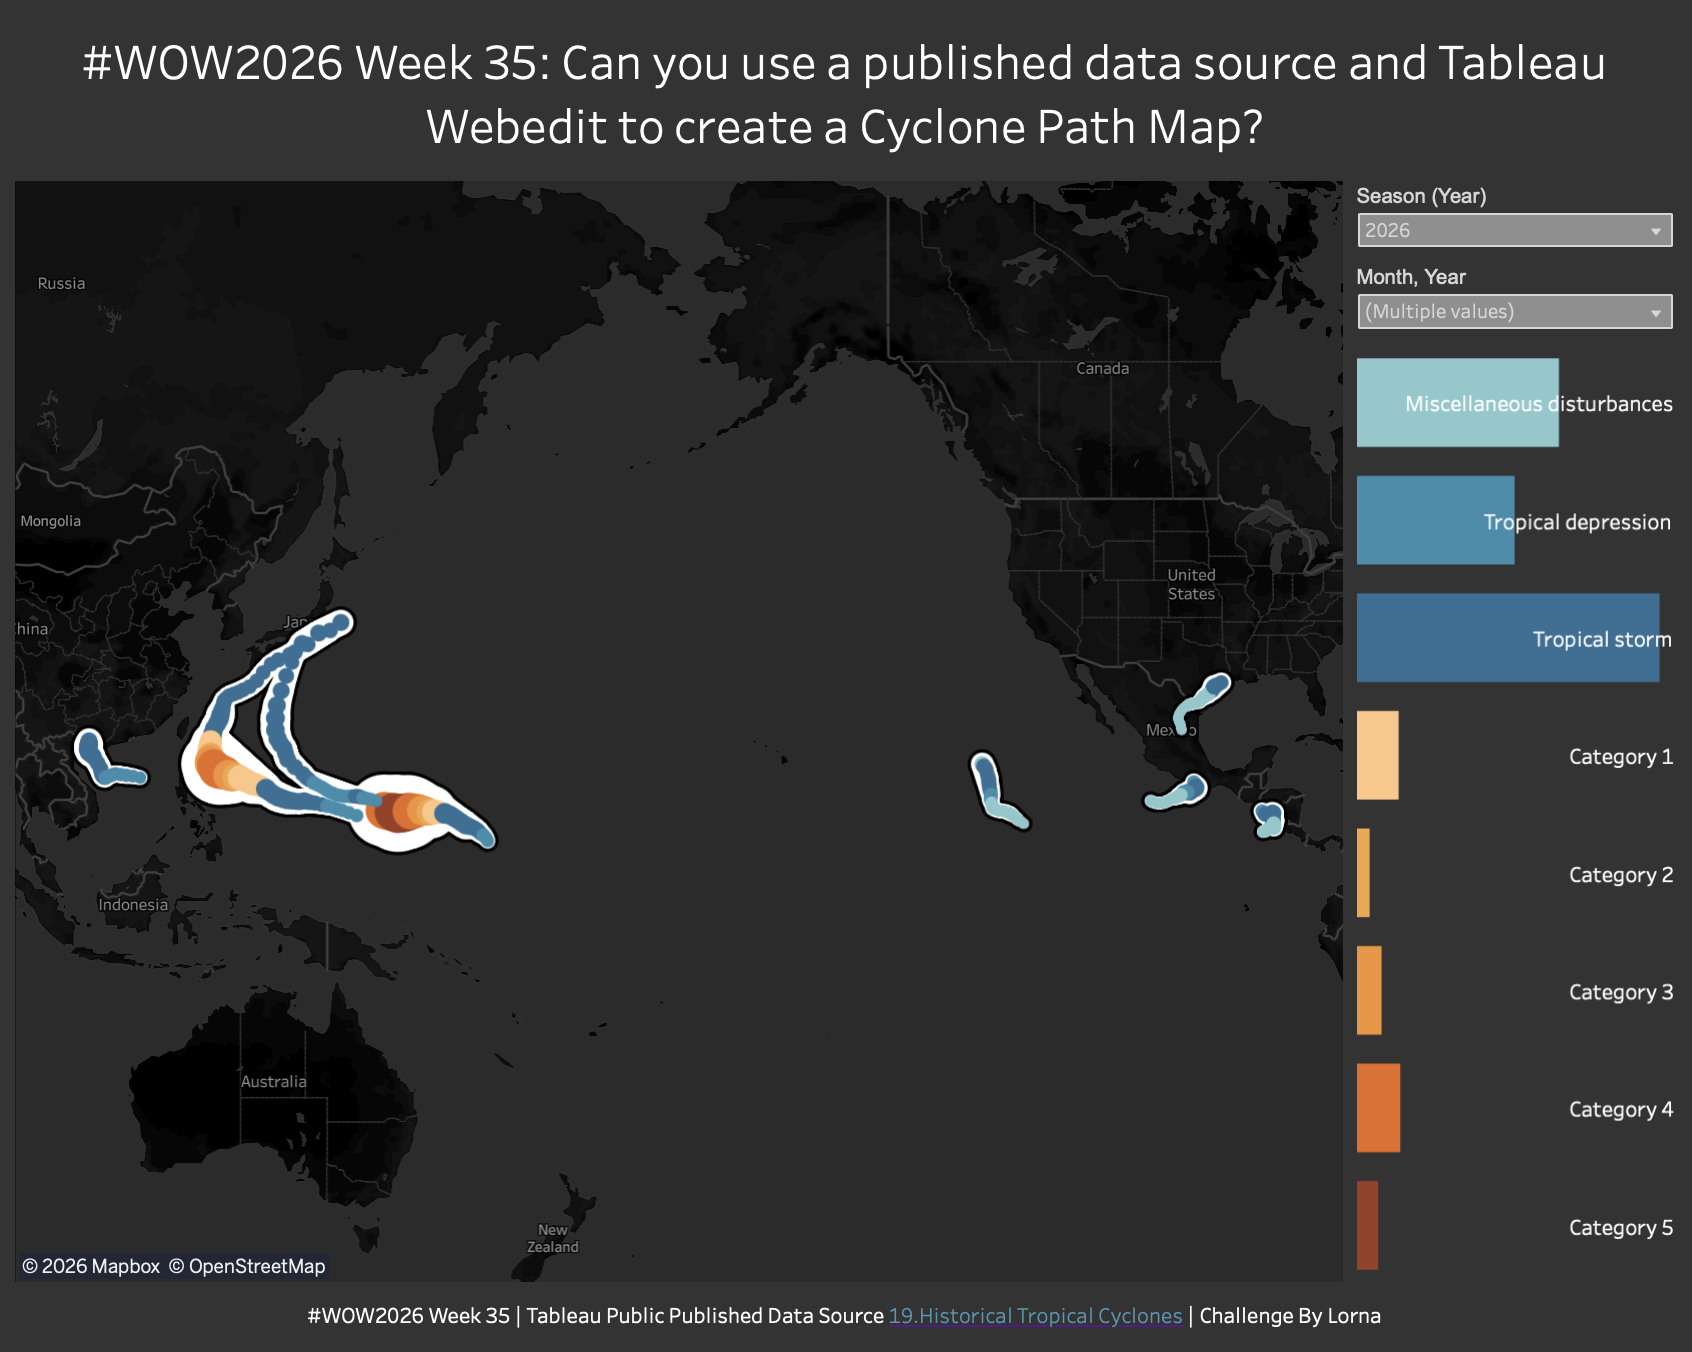
This week I wanted to use Tableau Publics WebEdit to build a viz with one of their published datasources. Granted not all of the formatting options are there that I would like, so some of the chart choices are a bit wackier than they would be in Desktop.
I would have love to have used Pages on this, but the formatting options to leave the trails were not there.
Enjoy!
Requirements
- Create a Cyclone Path Map using USA Wind Speed to show severity
- To categorise the Cyclones use the following from the documentation
- Match formatting as best as you can or create your own formatting
- The date selector should be based off of the minimum date per season and storm name
Dataset
Available from here.
Attribute
When you publish your solution on Tableau Public make sure to take the time and include a link to the original inspiration. Also include the hashtag #WOW2026 in your description to make it searchable!
Share
After you finish your workout, share on Twitter and/or LinkedIn using the hashtag #WOW2026 #Tableau and tag @WorkoutWednsday
