Introduction
This week’s challenge was derived from a project that I helped some colleagues with. My colleagues were working on a client project for a travel company. They wanted to be able to compare a selected “Event Date” with an average travel day. The aim was to see if and how travel patterns might be affected on these event days. Since travel can be seasonal and also varies by weekday, I suggested they compare their “Event Date” with a typical “Tuesday in March”, for example.
In order to bring this challenge to you, I needed a rich dataset that went down to the level of minutes (Date & Time). Initially I looked at using the ‘Hospital ER’ data from the #RealWorldFakeData community project, but I found too many gaps. So I turned to the time-based data sets available online for the Tableau Strategies book. However, I still liked the idea of analysing Patient Waittimes (like in the first data set), so I modified the call centre data to fit my plan.
You’ll need a solid grasp of DateTimes and Table Calculations to solve this one!
Requirements
- Dashboard Size: 1100 x 800px
- 2 Sheets
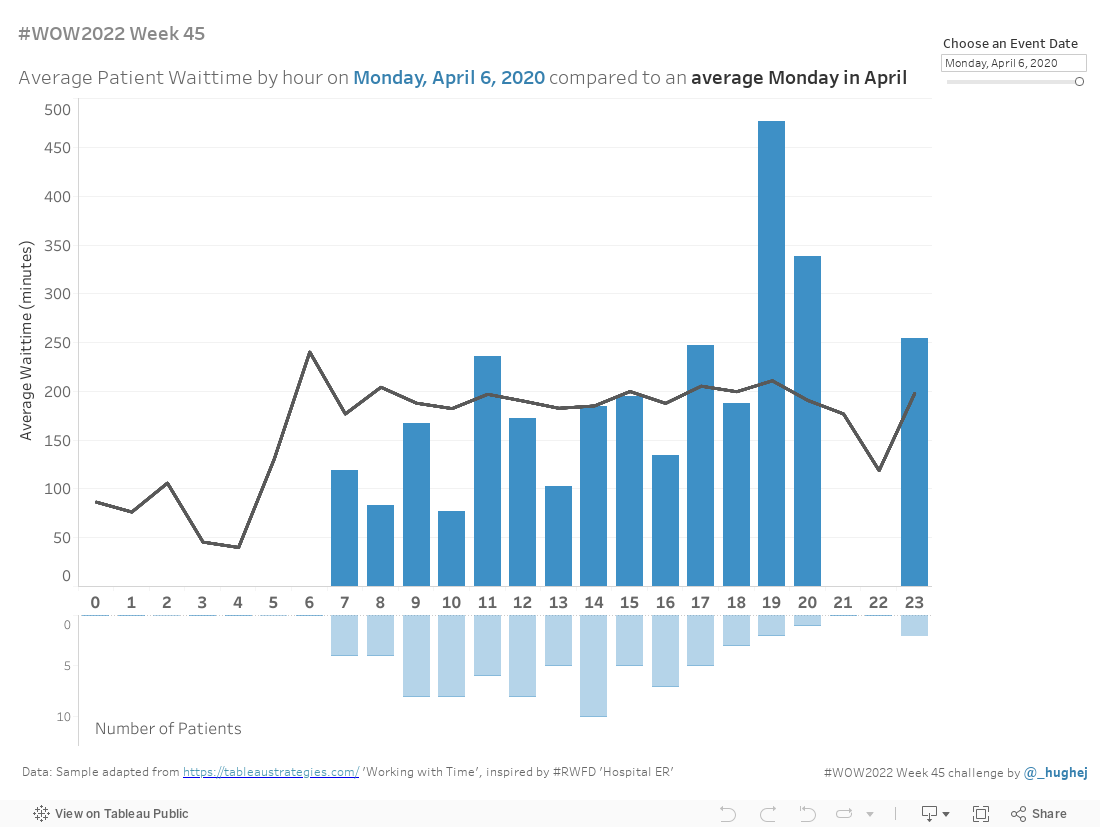
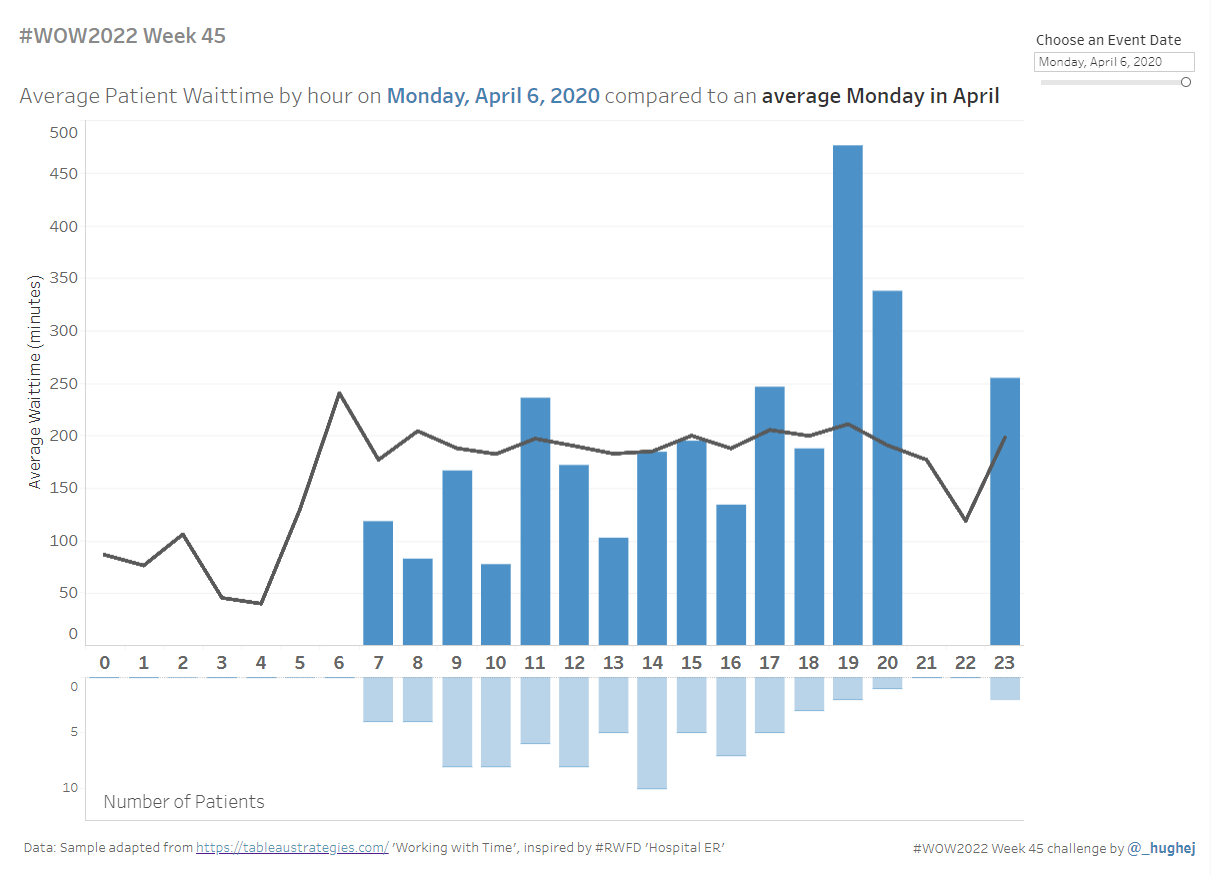
- Create a bar chart that displays the Average (AVG) Patient Waittime by hour for a Selected Event Date
- Next, create a line. I will use an example to explain what it shows:
- Let’s assume the selected date is Monday, 6th April 2020
- The line will show the AVG Patient Waittime by hour for all Mondays in April
- This allows us to compare the Event Date (blue bars) to an average Weekday of a particular Month (which is useful if we have seasonal data that also varies on weekends/different weekdays).
- Create a bar chart to display Number of Patients (this provides additional content for the averages numbers above it)
- Finally, match tooltips and formatting, although you can use whichever colour you choose!
Dataset
This week uses some sample data that was customised for this challenge. You can find it here on Data.World
The data was adapted from https://tableaustrategies.com/ ‘Chips and Bolts Call Center/Calls’ with inspiration from #RWFD https://domoorewithdata.com/home/real-world-fake-data/ ‘Hospital Emergency Room’.
Attribute
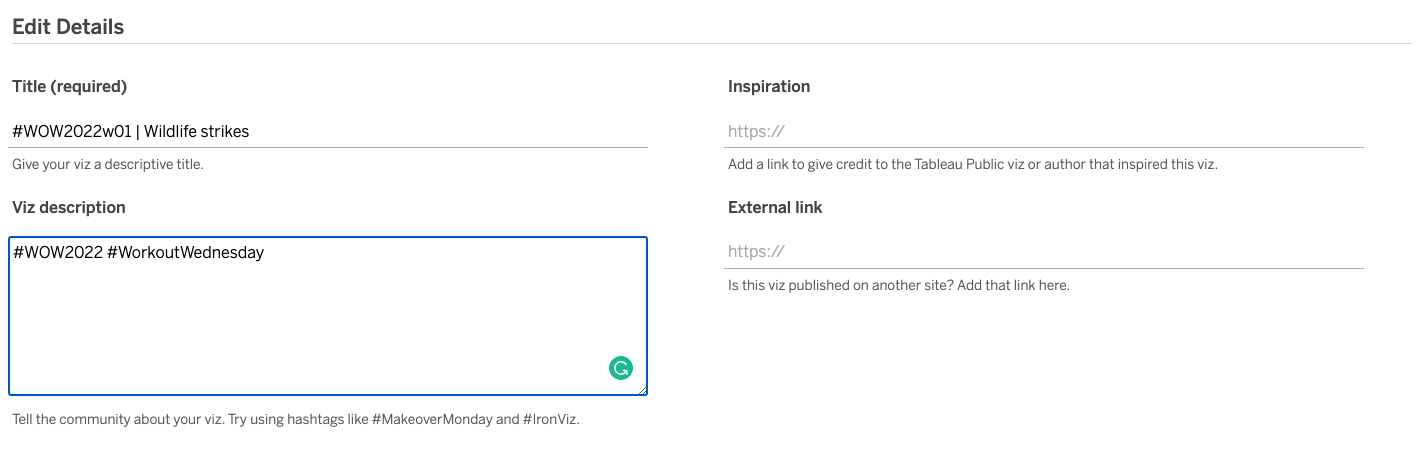
When you publish your solution on Tableau Public make sure to take the time and include a link to the original inspiration. Also include the hashtag #WOW2022 in your description to make it searchable!
Share
After you finish your workout, share on Twitter using the hashtag #WOW2022 and tag @LukeStanke, @_Lorna_Brown, @HipsterVizNinja, @_hughej, and @YetterDataViz
Solution
Interactive