Welcome to another week. Hard to believe we’re already at our 12th workout this year. I’ve been participating in these workouts since Andy started them with Emma WAY back in 2017 (ya know, like a decade ago 😀 ) Anyway, one thing I really enjoyed back then was the hyper-focused challenges on a particular technical aspect of Tableau. In honor of those challenges, I created my own.
This year we’ve had several table calc-focused challenges and everyone knows and loves the FIXED LoD expressions. But what about FIXED’s cousins INCLUDE & EXCLUDE? Where’s their love? They need just it just every other function…so let’s give them the spotlight.
You can complete this challenge however you like but just DON’T USE A FIXED LOD
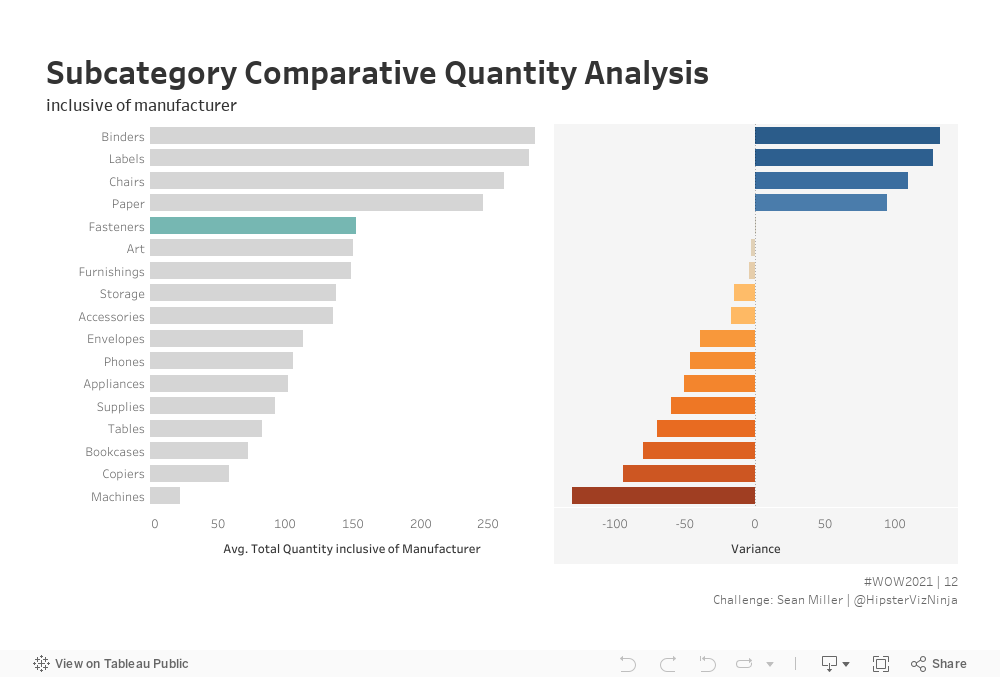
Total average sales by subcategory inclusive of manufacturer
Variance between Subcategory value and Selected Subcategory value
Create an interaction to click a Subcategory
Match tooltips, pay attention 🙂
And remember: No FIXED LOD
Dataset
This week uses the superstore dataset for Tableau 2020.4. You can grab it here at data.world
Attribute
When you publish your solution on Tableau Public make sure to take the time and include a link to the original inspiration. Also include the hashtag #WOW2021 in your description to make it searchable!