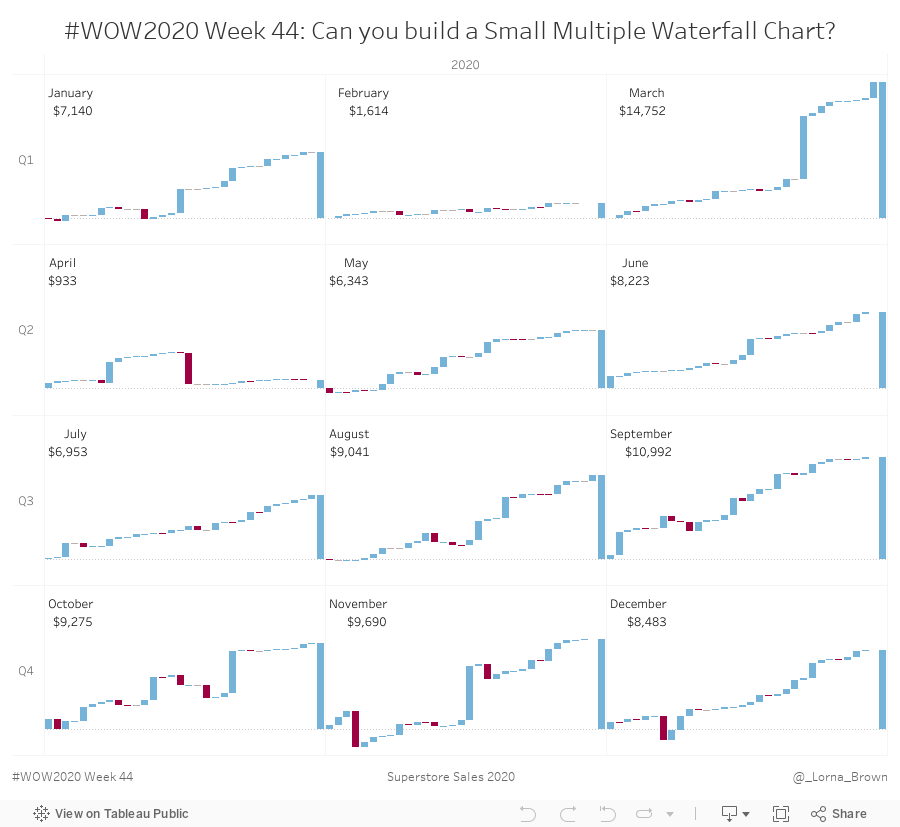
This week I struggled to get creative, but thought about what types of charts have we not built for a previous WOW. As far as I can see this has not been done in the past. So good luck! This chart is looking at the rise and fall of profit with a month.
Be able to distinguish between positive and negative profit
Have month labels
Match tooltips
Dataset
This week uses the superstore dataset for Tableau 2020.3. You can get it here at data.world
Attribute
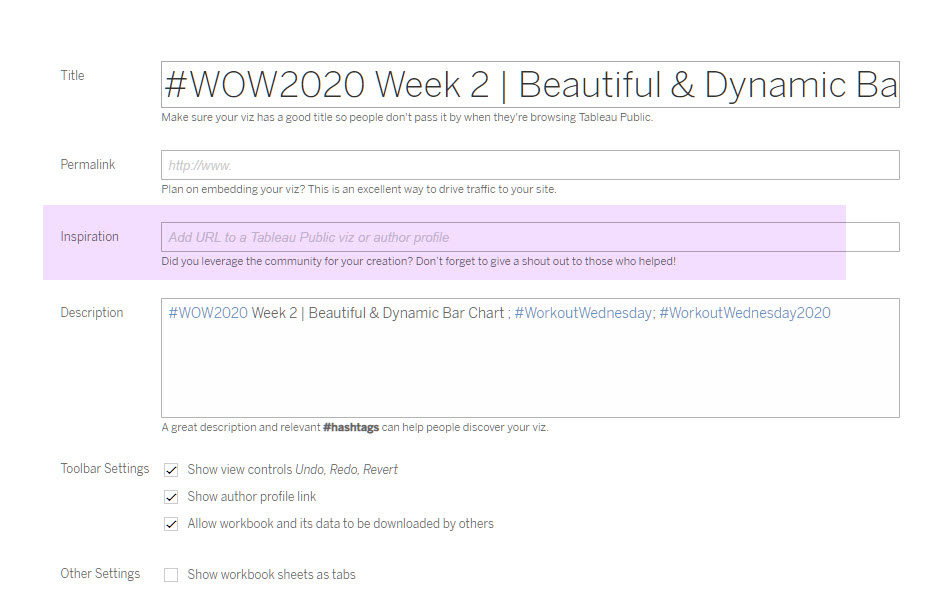
When you publish your solution on Tableau Public make sure to take the time and include a link to the original inspiration. Also include the hashtag #WOW2020 in your description to make it searchable!