2020 Week 31 LIVE: Can you show the top 10 rank over time for each Olympic country?

Introduction

For this weeks challenge we are doing a Live collaboration with Preppin’ Data. Where you work through the data prep and then use the outputs to build in Tableau. This is a live event happening on Wednesday 29th July 2020, 4pm BST.

The idea of the collaboration allows you to have a look inside the world of data prep,

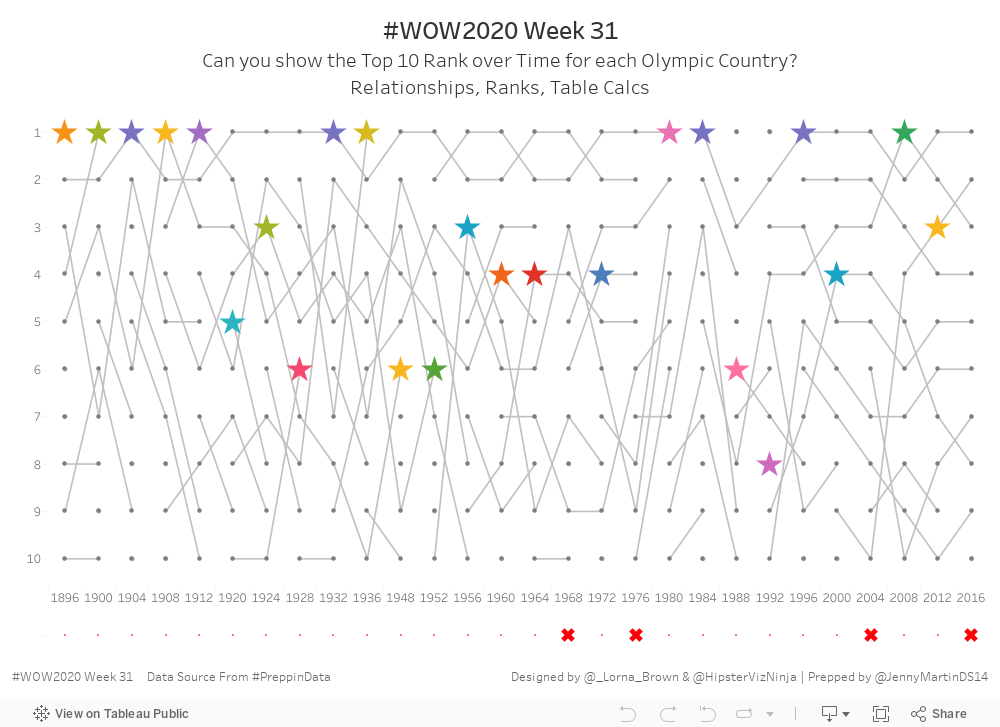
This weeks Workout Wednesday challenge involves the new data model, so you will need 2020.2 (can be achieved using blending for earlier versions).

Requirements

  • Dashboard size 1000 x 700
  • Using the 3 datasets create a relationship based on year and country
  • Create a rank bump chart showing the top 10 countries over time based on their medal score (Gold = 3, Silver = 2 and Bronze = 1)
    • Make sure the line doesn’t connect if they drop out of the top 10 for a couple of years
    • Highlight where the host came using a star
    • In the tooltip show how many Gold, Silver Bronze medals that country won and the top 10 medalists
  • If the host didn’t make the top 10, show that with the crosses at the bottom
    • Create a viz in tooltip that shows the top 10 countries and where the host country finished in Red if it was outside the top 10.

Note: Host Country Colours using Hue colour Palette

Dataset

This week uses data sets created from the Preppin’ Data Challenge

Data Sets will be posted after the live event

Here are the data sets on Data.World

Attribute

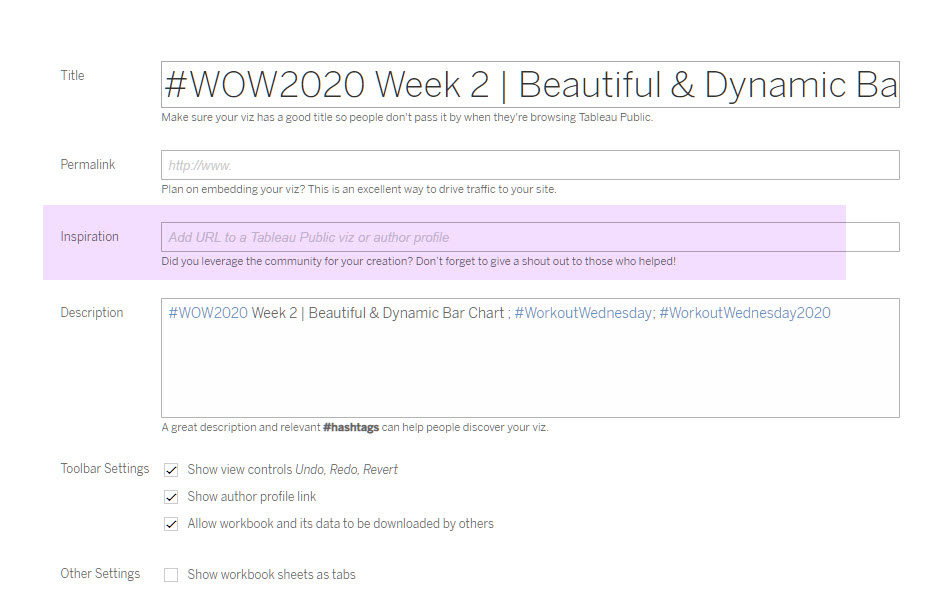
When you publish your solution on Tableau Public make sure to take the time and include a link to the original inspiration.  Also include the hashtag #WOW2020 in your description to make it searchable!

Share

After you finish your workout, share on Twitter using the hashtag #WOW2020, #PreppinData and tag @AnnUJackson@LukeStanke, @_Lorna_Brown and @HipsterVizNinja

Solution

Interactive

Leave a Comment

Your email address will not be published. Required fields are marked *

Scroll to Top