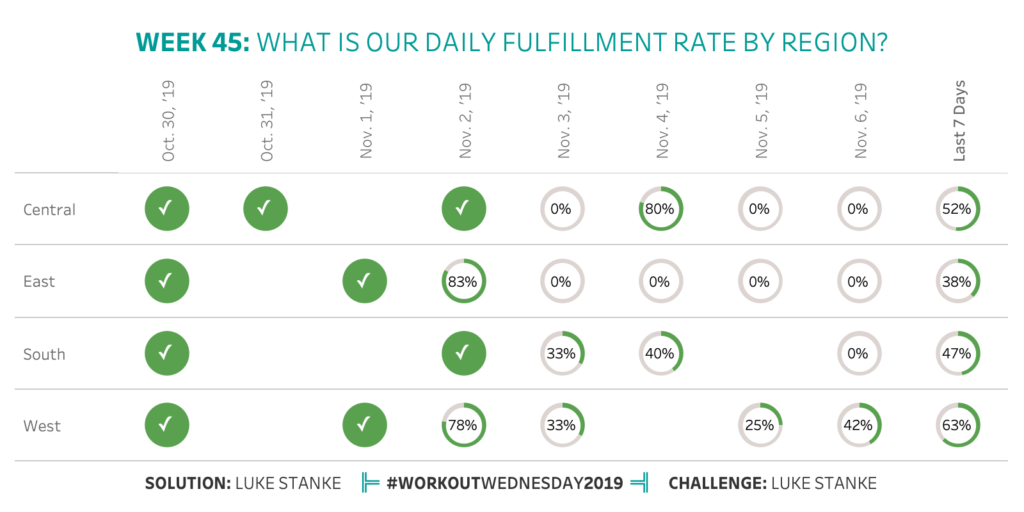
2019 Week 45: What is our daily fulfillment rate by region?
For this week’s challenge I was working on our own internal dashboards trying to show progress to a series of targets and landed on the this week’s challenge! This one combines my favorite chart type: the donut chart with the humble checkmark. – LS Challenge Click image to view on Tableau Public Requirements Format: 800px […]
2019 Week 45: What is our daily fulfillment rate by region? Read More »