Challenge

Click to view on Tableau Public
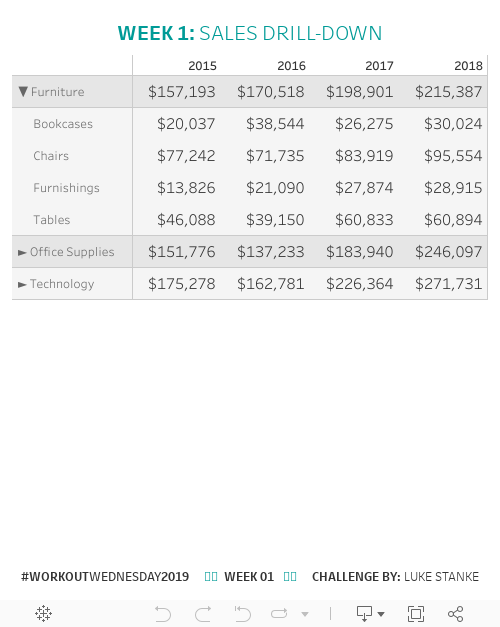
Requirements
- Dashboard size is 500px wide by 600px tall.
- Create a table that shows sales for category and year. When you click on a category show the sales by sub-category below it.
- Use the right arrow “►” and the down arrow “▼” to indicate when details are showing. This makes it look like an accordion.
- Match row borders and row shading to highlight these values.
Dataset
This week uses the superstore dataset for Tableau 2018.3. You can get it here at data.worldShare
After you finish your workout, share on Twitter using the hashtag #WorkoutWednesday2019 and tag @AnnUJackson, @LukeStanke, @lorna_eden, @curtisharris_, and @VizWizBI!Track your progress
Also, don’t forget to track your progress using this Workout Wednesday form.Spoilers
- Union the data to itself one time.
- One part of the union will create the summary for category and the other will create the summary for sub-category.