Report Building

DataViz Makeover of bar chart

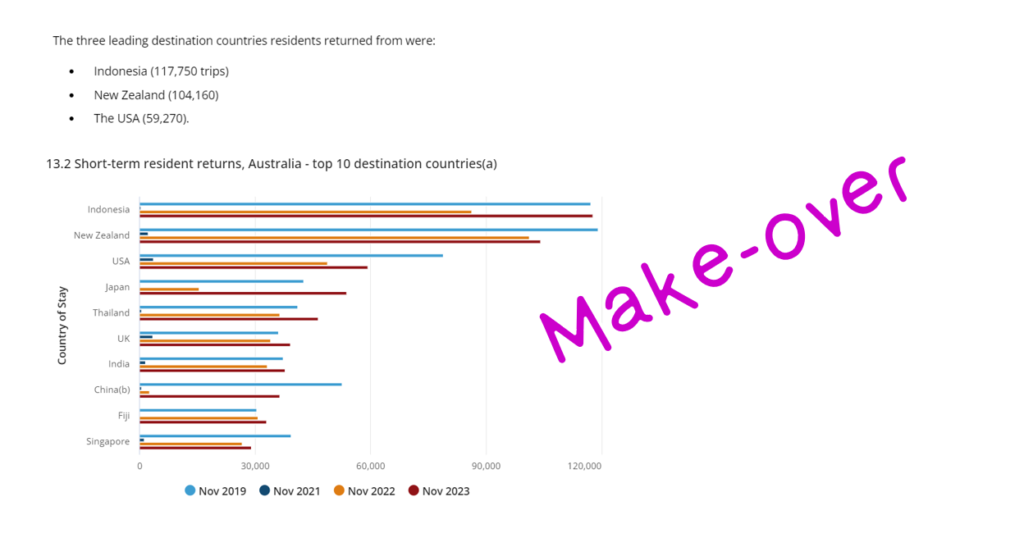
2024 Week 7 | Power BI: Report Re-design – Aussie trips to Indonesia

Introduction This week’s challenge is a little different, we will be looking to make-over a report from the Australian Bureau of Statistics. This report contains a lot of information and data sources to download, so it is up to you as to how much or how little you want to do. The primary challenge, however, …

2024 Week 7 | Power BI: Report Re-design – Aussie trips to Indonesia Read More

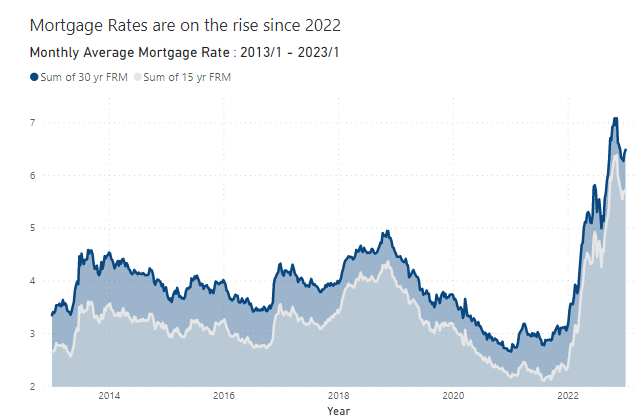
2023 Week 04 | Power BI: Mortgage Rates Area Chart

Introduction Hello everyone! I’m excited to have my first challenge of 2023 up and ready for your enjoyment. Last year I got a reputation as providing challenges that were, let’s say….a little on the easier side, so this year I’m just going to own it!  I was scrolling Twitter in hopes of finding some inspiration …

2023 Week 04 | Power BI: Mortgage Rates Area Chart Read More

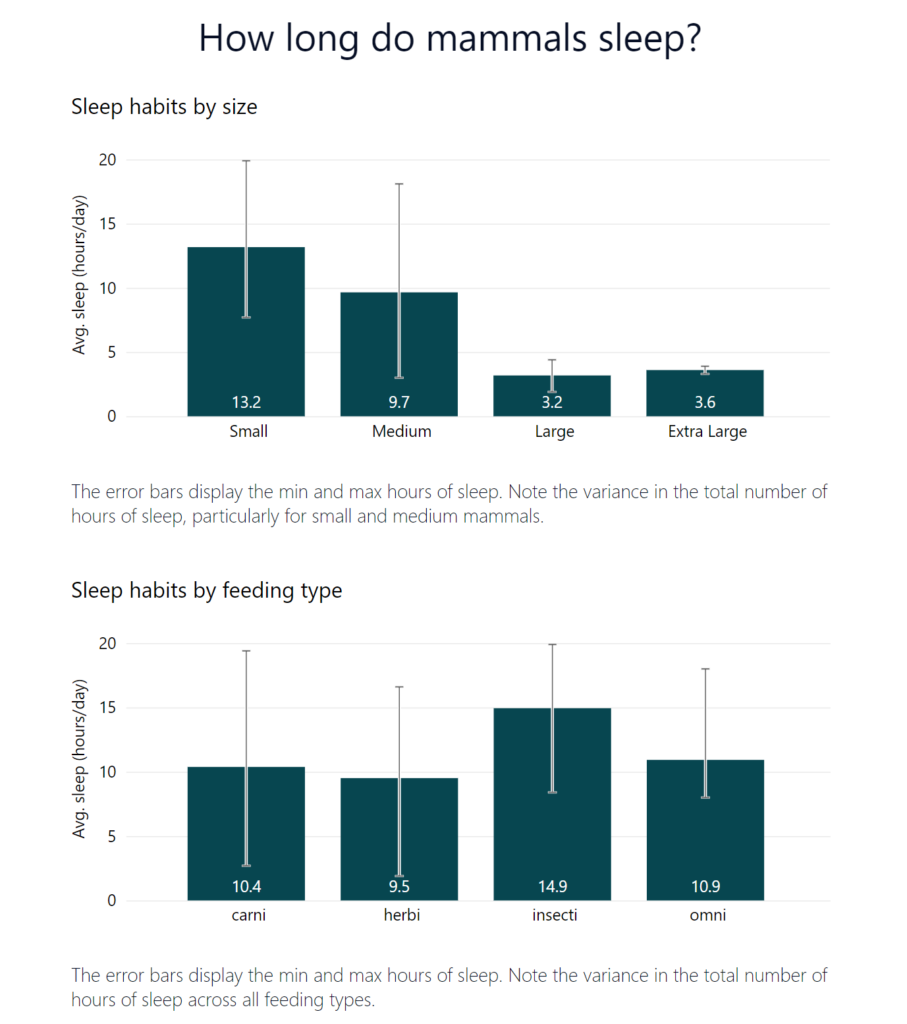
2022 Week 28 | Power BI: Error Bars

Introduction Welcome back to Workout Wednesday! If you’re joining us for the first time, welcome! We present you with a challenge, a dataset to recreate the challenge, and a solution video or file. You can use these challenges to build your skills and your portfolio! This week we’re exploring the error bars feature in Power …

2022 Week 28 | Power BI: Error Bars Read More

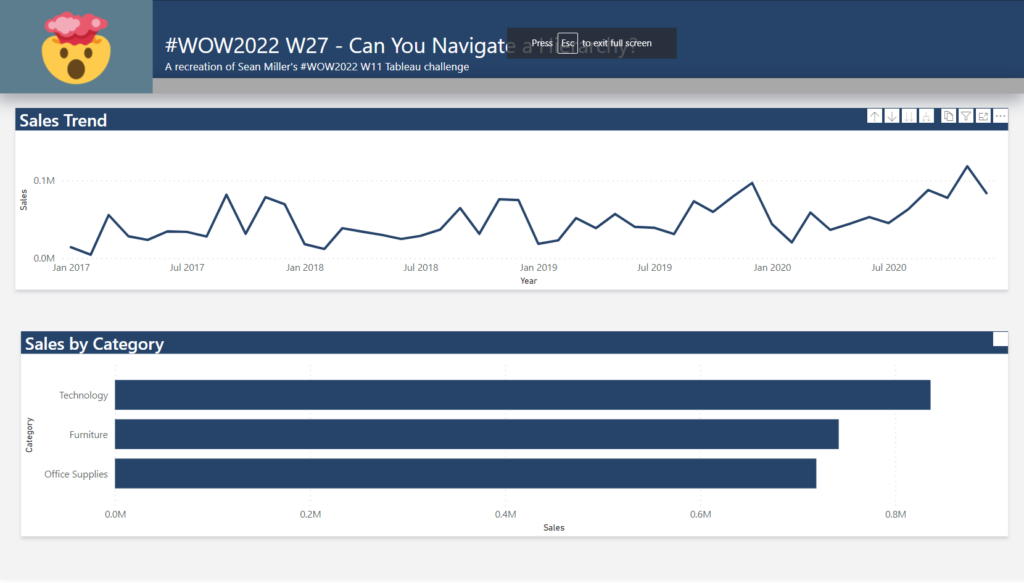
2022 Week 27 | Power BI: Navigating Hierarchies

Introduction If you weren’t aware, June was Music Month and Kerry Kolosko gave us a brilliant visualization of Beatles tunes using Charticulator – you can check out the challenge here.    This week we are going to be recreating a recent Tableau challenge from Sean Miller that was featured in Week 11 of this year’s Tableau …

2022 Week 27 | Power BI: Navigating Hierarchies Read More

2022 Week 21 | Power BI: Field Parameters

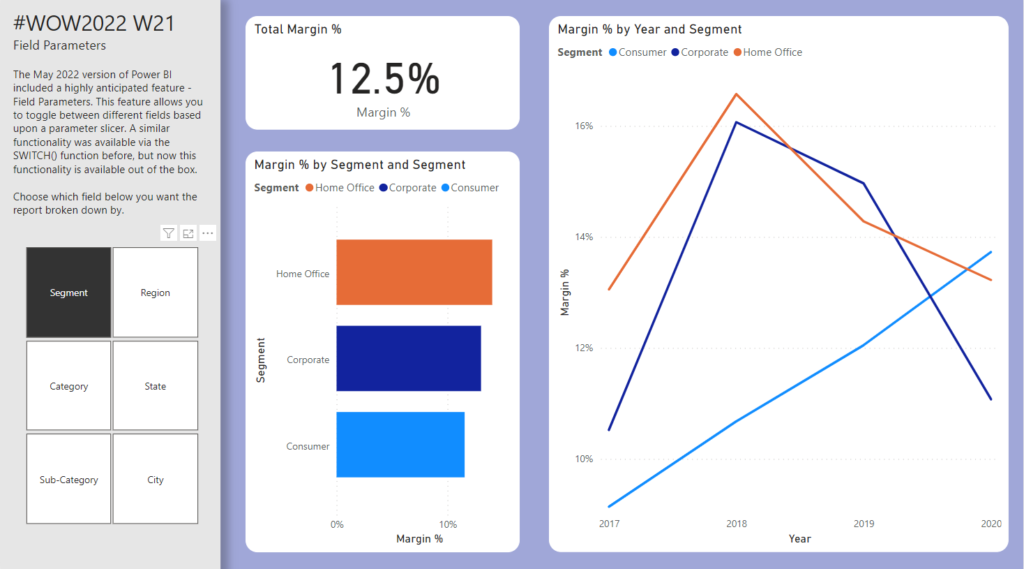
Introduction May is Tableau Redo month, so if you haven’t checked out last week’s report by Kerry Kolosko, make sure to check it out here. Most of the challenges this month have been Power BI remakes of previous Tableau Workout Wednesdays, but this week there was a really big release for the newest version of …

2022 Week 21 | Power BI: Field Parameters Read More

2022 Week 12 | Power BI: Build a Slicer Panel

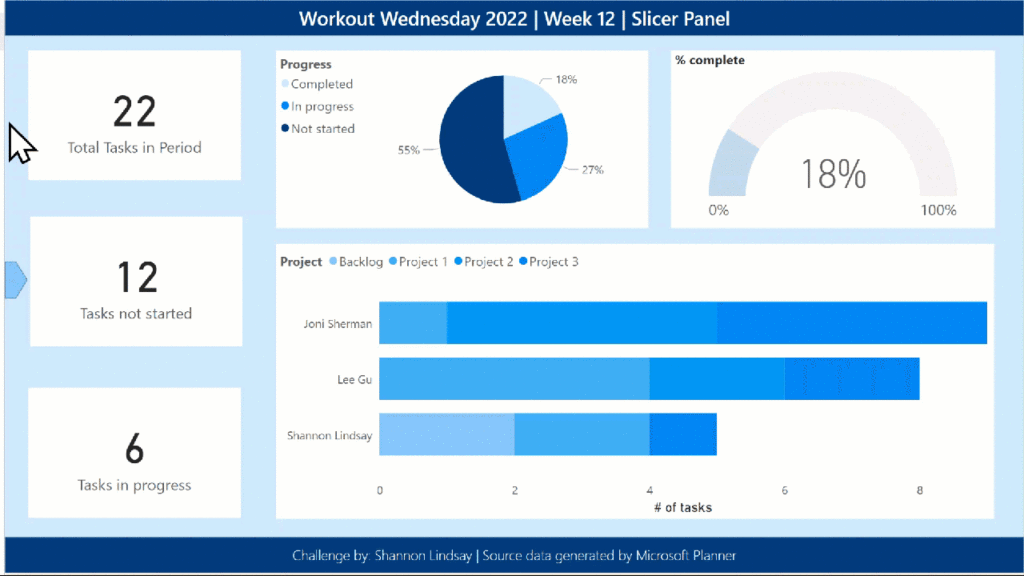
Introduction Welcome back to Workout Wednesday – we’re glad you’re here! This week, we’re continuing on with our project management theme. We’re tracking project progress using data generated from Microsoft Planner. Using Power BI with Planner (as opposed to using the inbuilt charts) enables us to both customize visuals and to view more than one plan at …

2022 Week 12 | Power BI: Build a Slicer Panel Read More

2022 Week 11 | Power BI: Project Budget Tracker

Introduction Your challenge this week is to create a Project Budget Tracker leveraging the IT Spend Analysis example dataset available to everyone in Power BI Service.  We decided to keep the project management theme going this week with this take on tracking how your project is following the budget.  If you did not do last week’s challenge, I …

2022 Week 11 | Power BI: Project Budget Tracker Read More

2022 Week 10 | Power BI: Risk Matrix

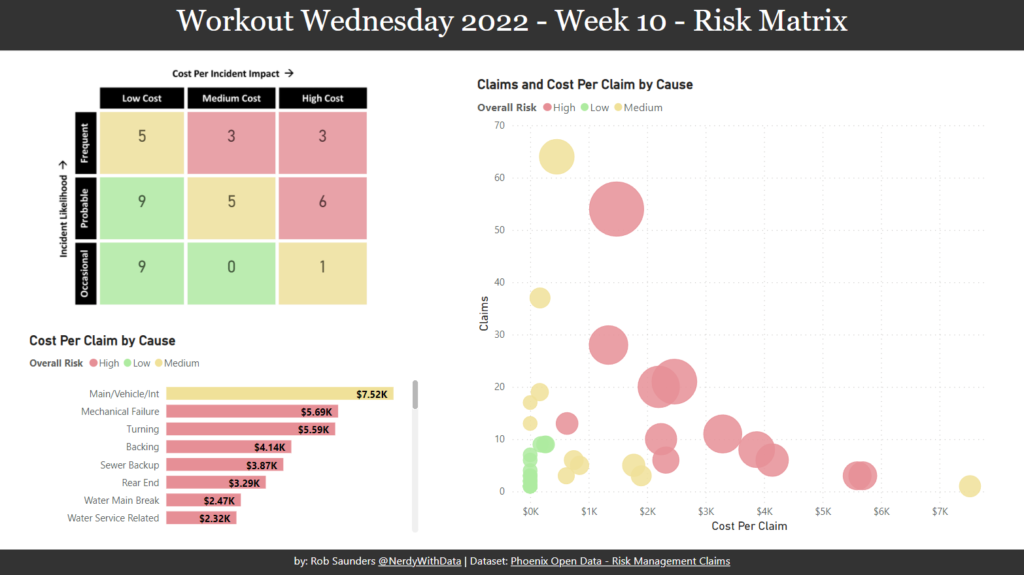
Introduction Your challenge this week is to create a Risk Matrix with some supporting visuals.  We decided to keep the project management theme going this week.  If you did not do last week’s challenge, I highly recommend you checkout Kerry’s Gantt Chart challenge, here.   For this challenge, I looked at a lot of possible ways to create a …

2022 Week 10 | Power BI: Risk Matrix Read More

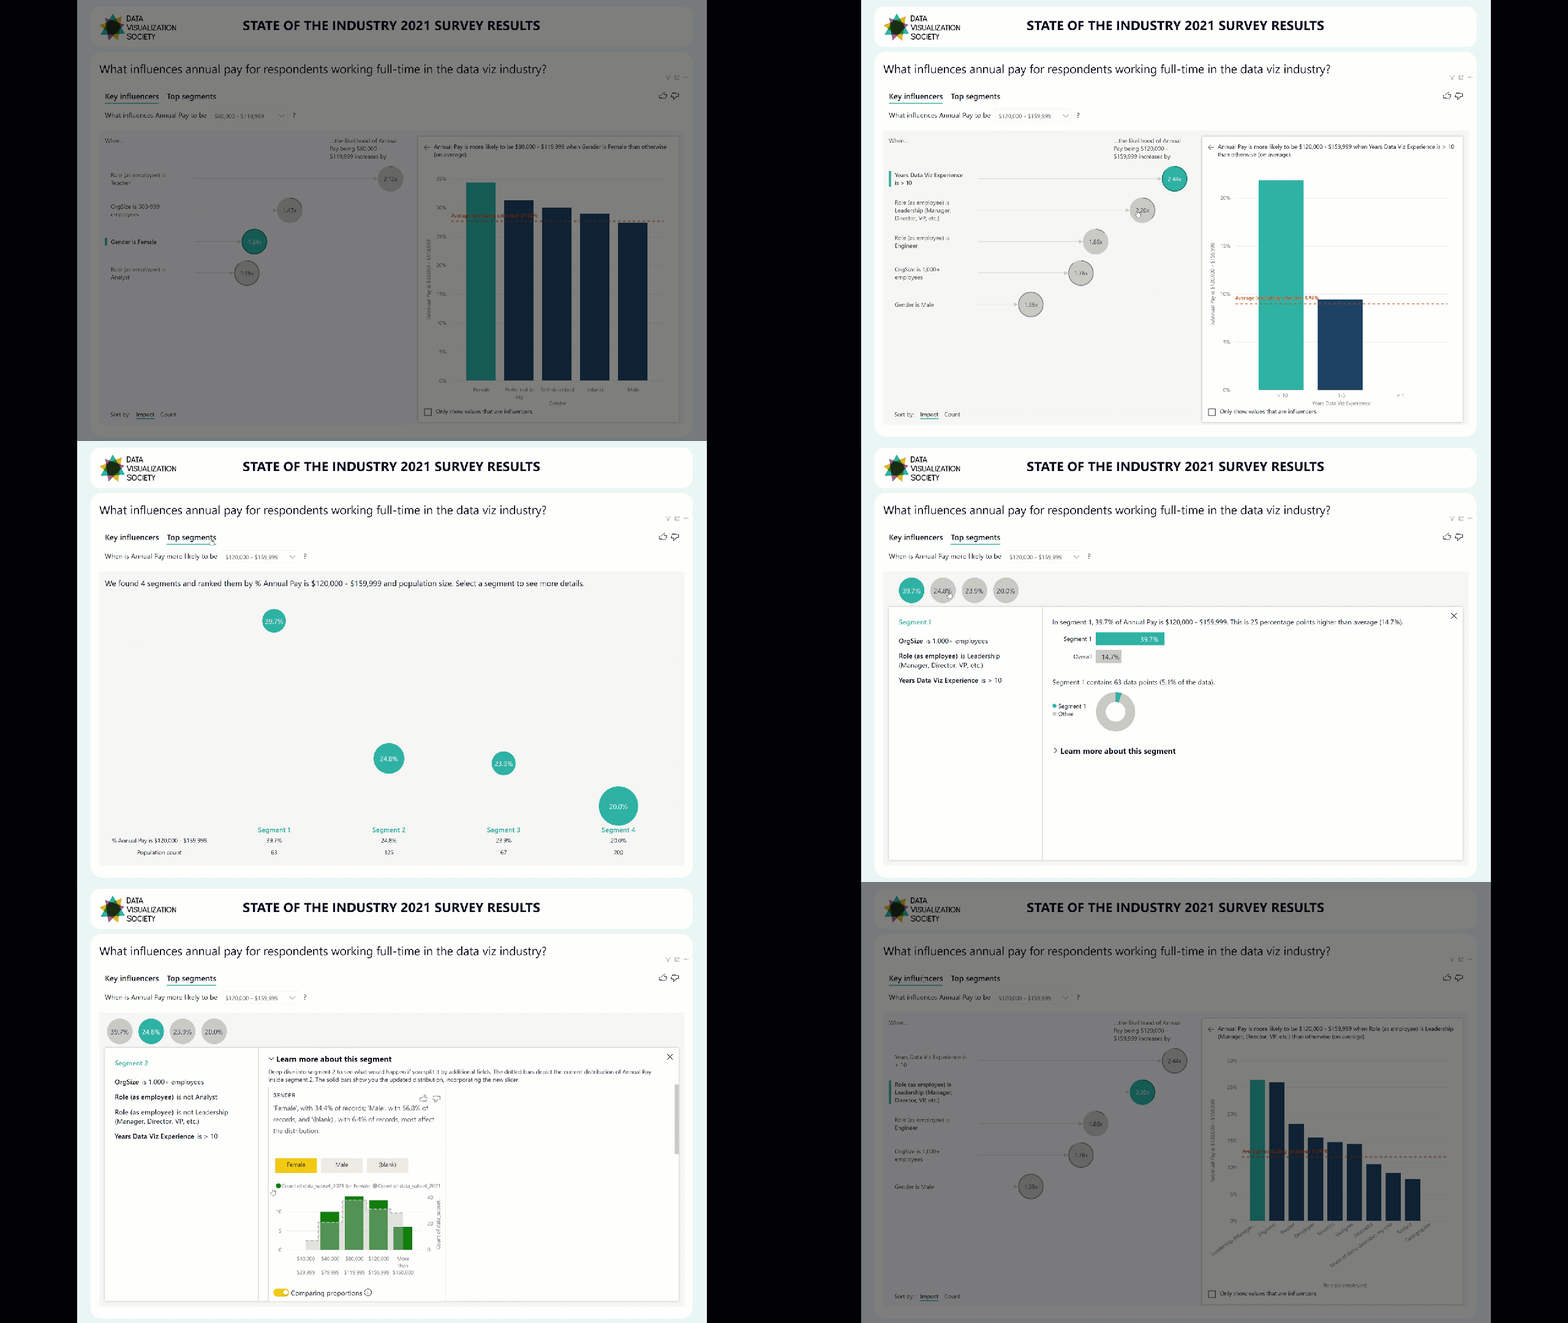
2022 Week 06 | Power BI: Key Influencers

Introduction Welcome back to Power BI #WorkoutWednesday – we’re now in week 6! If you’re joining us for the first time, welcome! There are no dependencies on previous weeks – you’re welcome to jump right in with this week’s challenge, where we’ll use AI in Power BI to get an understanding of key influencers of …

2022 Week 06 | Power BI: Key Influencers Read More

Scroll to Top