Report Building

2022 Week 02 | Power BI: Simplified Custom Page Navigation

Introduction Welcome back to Power BI #WorkoutWednesday – week 2! We had incredible participation last week and are so excited to dive in this week with custom page navigation. If this sounds familiar, it’s because we did a similar navigation challenge back in November 2021. In a fortunate turn of events, the Power BI team …

2022 Week 02 | Power BI: Simplified Custom Page Navigation Read More

2022 Week 01 | Power BI: Sparklines!

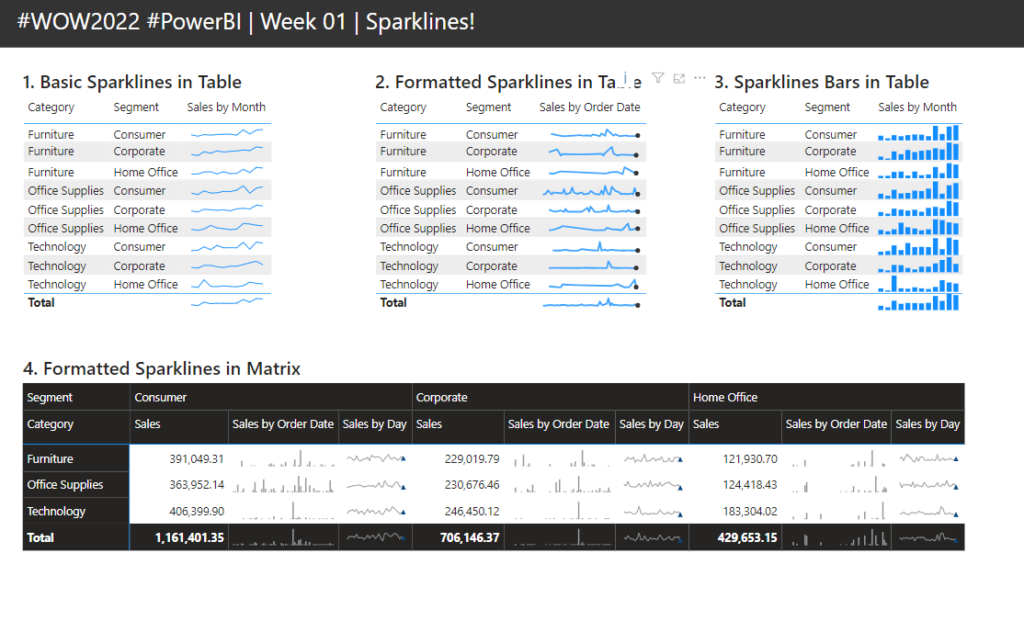
Introduction Welcome back to another year of Power BI #WorkoutWednesday! We hope you enjoy the challenges that we are going to present you this year. To get this year started off right, this week’s challenge will be introducing you to a feature that was released in the December 2021 Power BI Desktop release, sparklines. I’ve …

2022 Week 01 | Power BI: Sparklines! Read More

2021 Week 45 | Power BI: Create a Custom Navigation Experience

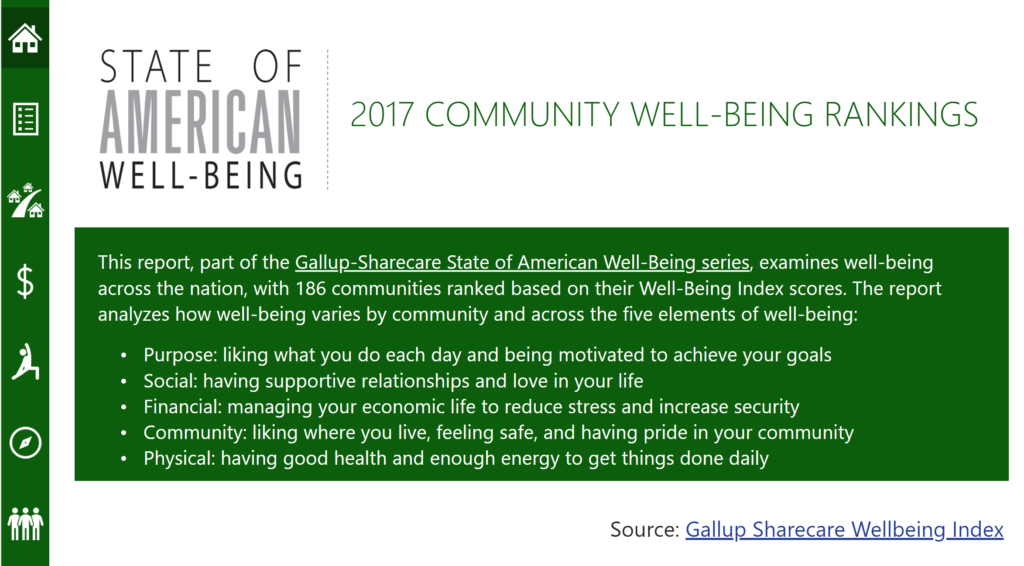
Introduction We hope that you had a lot of fun last week re-designing Spencer’s report! This week we’re also focusing on design and creating a custom navigation experience using bookmarks and buttons.  I am looking for a new place to live and stumbled upon the 2017 State of American Well-Being report. This PDF report details community well-being …

2021 Week 45 | Power BI: Create a Custom Navigation Experience Read More

Workout Wednesday Week 39

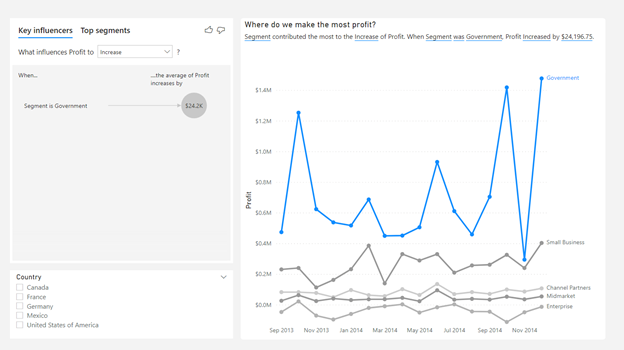
2021 Week 39 | Power BI: Assist Your Data Exploration with AI

Introduction It can be challenging getting a new dataset and quickly finding something to focus on and tell a story about. Power BI has built in tools that help you quickly identify data points of interest, and provides visuals that can help tell the story. Have Power BI help you tell the story with your …

2021 Week 39 | Power BI: Assist Your Data Exploration with AI Read More

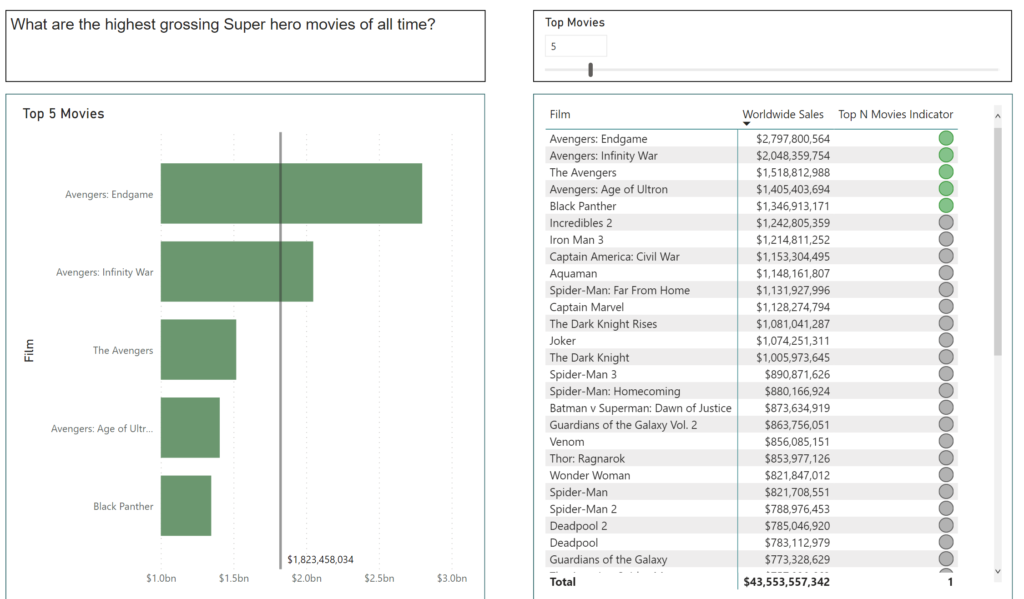
2021 Week 37 | Power BI: What-If Parameters

Introduction This week’s Workout Wednesday we will be using “What-If” Parameters to show Top N values based on user selection. What-If Parameters can allow your audience to have more self-service interaction with the dashboard. For this challenge, we will be visualizing the Top N Movies based on Worldwide sales, as well as leveraging conditional formatting to …

2021 Week 37 | Power BI: What-If Parameters Read More

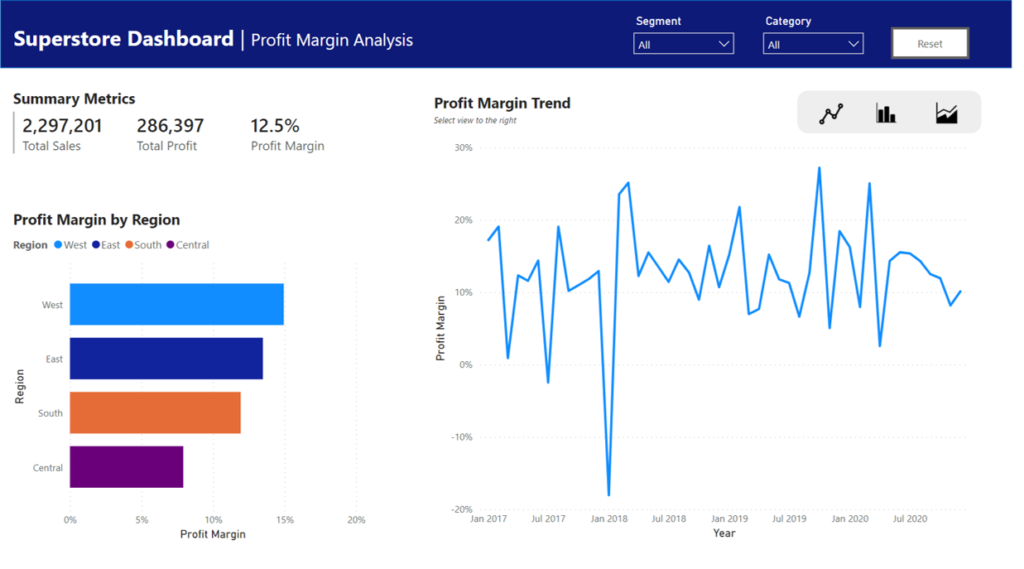
2021 Week 32 | Power BI: Toggling Views with Bookmarks

Introduction This week we are going to be exploring how to use Bookmarks to toggle between different views in a report. There are a number of things you can do with Bookmarks, but in this week’s example we are going to use them to toggle between chart views and then as a Reset Filters button. …

2021 Week 32 | Power BI: Toggling Views with Bookmarks Read More

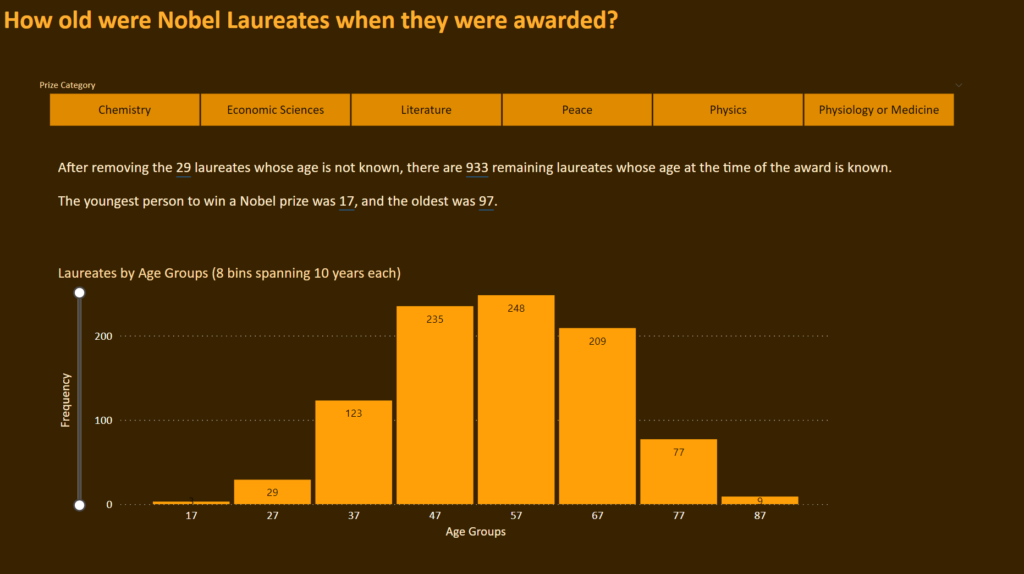
Power Bi 2021 week 26 showing a histogram with 8 even bins

2021 Week 26 | Power BI: Make a Histogram with Equal Size Bins

Introduction This is our last week using the Nobel Prize data. We are again looking at the age of the laureate when they were awarded the prize. This time we will examine it using a histogram. Histograms measure the distribution of data within defined ranges. So we are calculating age and creating bins of equal …

2021 Week 26 | Power BI: Make a Histogram with Equal Size Bins Read More

2021 Week 8 | Power BI: SWITCH()ing Measures

Introduction Thanks to everyone who has ben participating in #WorkoutWednesday – Power BI edition. This week we are going to be diving into switching metrics in your reports using SWITCH() and a slicer. This method can be especially useful when designing reports for mobile use. Toggling between metrics allows you to save real estate on …

2021 Week 8 | Power BI: SWITCH()ing Measures Read More

Scroll to Top