
groupings

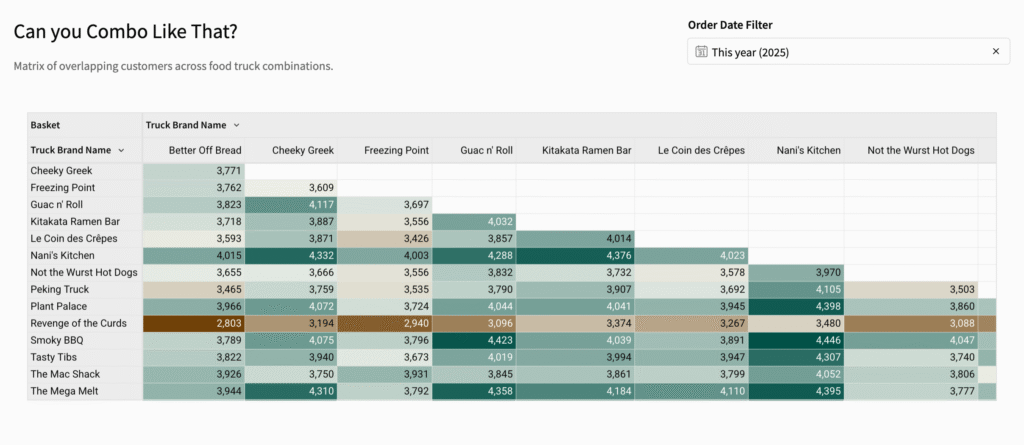
2025 Week 21 | Sigma : Can you Combo Like that?

Introduction This week, we’re building a market basket or matrix analysis to help us understand the frequency of combinations. For this week’s challenge, we’re looking at which Food Trucks have the most customers in common.  Have Fun! Katrina Need access to Sigma? Click Here to Sign Up Link to WOW Sigma Instance Youtube Click here […]

2025 Week 21 | Sigma : Can you Combo Like that? Read More »

Sigma, Workout Wednesday

2025 Week 13 | Sigma : Can you track the winning streak?

Introduction For this week, we’re exploring row order dependant calculations. In this scenario, we’re trying to understand how our hometown baseball team’s winning streak impacts attendance. Are folks more likely to attend if the team keeps winning? Let’s find out!   Have Fun!Katrina Need access to Sigma? Click Here to Sign Up Link to WOW Sigma

2025 Week 13 | Sigma : Can you track the winning streak? Read More »

Sigma, Workout Wednesday
2024 Week 51 | Sigma : Can you calculate weekly progress?

Introduction Surprise! I have one more challenge for the year. This challenge was inspired by a workbook I created in my early Sigma days. We wanted to track weekly progression toward a quarterly total. Sounds easy, right?  I thought so, too! But then I realized that DateTrunc(“week,” [Date]) would duplicate the week label across quarters.

2024 Week 51 | Sigma : Can you calculate weekly progress? Read More »

Sigma, Workout Wednesday
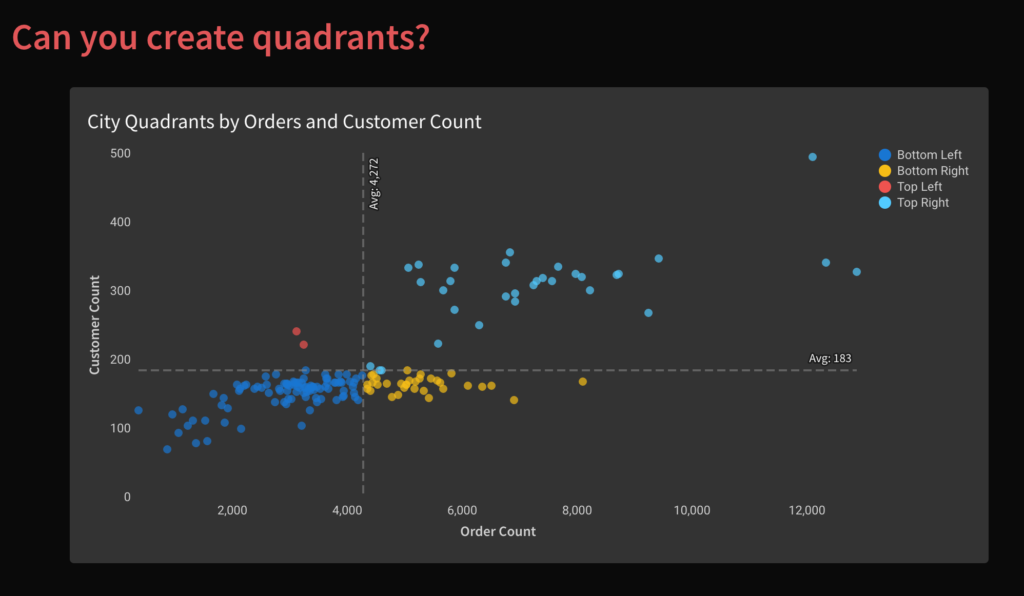
2024 Week 20 | Sigma: Can you create quadrants?

Introduction Week 20 already! Crazy how fast the year is going by…and how fast you’re skilling up in Sigma! I love scatter plots. They’re a great way to display a lot of information in an easily consumable package. Layering quadrant colors on top, make it even easier to visually group dots and find outliers.  -Katrina

2024 Week 20 | Sigma: Can you create quadrants? Read More »

Sigma, Workout Wednesday

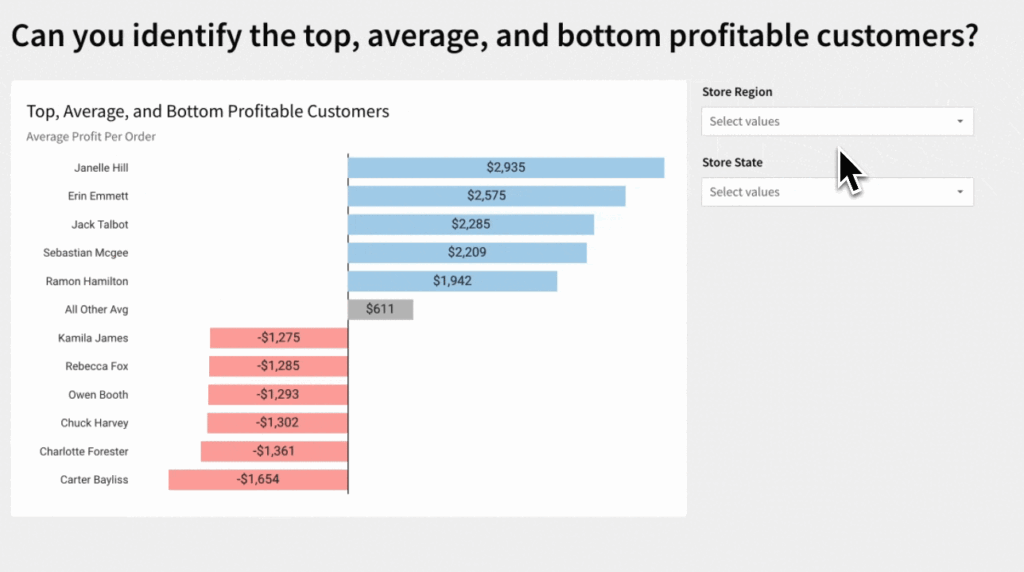
2024 Week 15 | Sigma: Can you identify the top, average, and bottom profitable customers? 

Introduction This week, we’re building a staple in my bar chart library: Top, Bottom, and Other Values. I often use this bar chart to easily show the breadth of the outliers while not losing sight of the typical. This challenge is also a great example of the flexibility of modeling at different levels of granularity

2024 Week 15 | Sigma: Can you identify the top, average, and bottom profitable customers?  Read More »

Sigma, Workout Wednesday