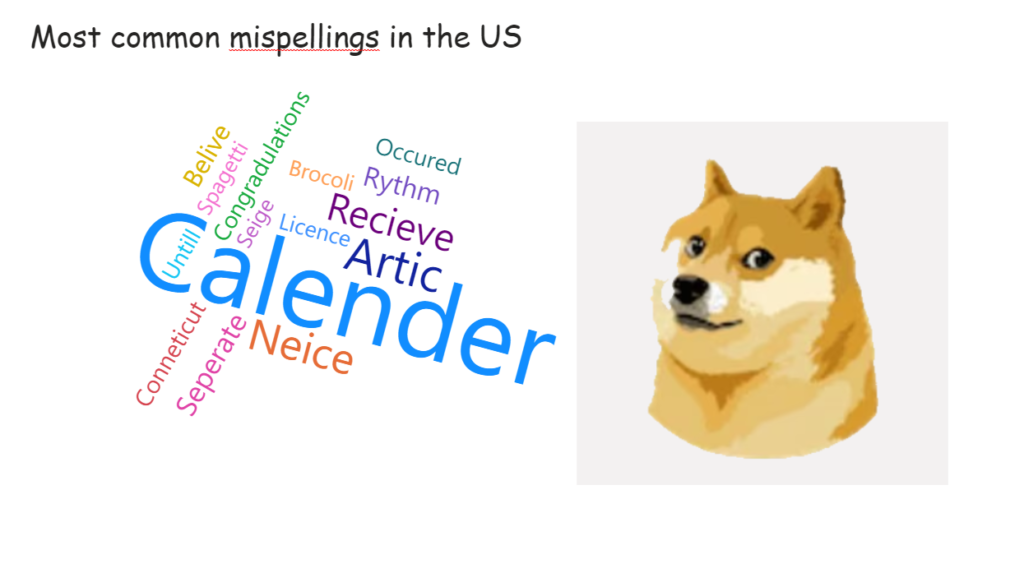
Power BI

2023 Week 07 | Power BI: Non-linear Regression

Introduction This week for Workout Wednesday we will be trying our hand at non-linear regression with the Deneb custom visual. With Vega and Vega-Lite we can create a non-linear line of best fit over our data points and utilise the statistical API to return a correlation coefficient. Requirements Power Query Obtain the dataset from the […]

2023 Week 07 | Power BI: Non-linear Regression Read More »

2023 Week 05 | Power BI: Visualize the Oscars with an Isotype/Pictogram Chart

Introduction Hello and welcome back to Workout Wednesday! If you’re joining us for the first time, be sure to check out our complete list of challenges. This week we’re looking at data from the American Academy Awards, also known as the Oscars. The Oscars are awards for artistic and technical merit for the American film industry

2023 Week 05 | Power BI: Visualize the Oscars with an Isotype/Pictogram Chart Read More »

Vertical Area Chart describing Republican and Democrat shifts in ideology

2023 Week 03 | Power BI: Vertical Area Chart

Introduction Howdy All! We’re all topsy-turvey this week turning line charts on their side! ⇩ This weeks challenge was inspired by Nick Desbarats article Are Vertical Line Charts Ever a Good Idea? Can you find some other examples where vertical line charts may be a good idea? ⋟^◕ܫ◕^⋞ Happy Vizzing Requirements Power Query Obtain the voteview_polarization_data.csv

2023 Week 03 | Power BI: Vertical Area Chart Read More »

Area charts with layered series

2023 Week 02 | Power BI: Create layered line/area charts with labels and annotations

Introduction For our second week of Workout Wednesday 2023 Power BI Edition, we are taking inspiration from a recent Washington Post interactive story titled “See just how bad a year it was for your retirement account — and why”. The article looks at the closing price of the S&P 500, comparing the value at the

2023 Week 02 | Power BI: Create layered line/area charts with labels and annotations Read More »

2023 Week 01 | Power BI: Use DAX to control visual display

Introduction Welcome to Workout Wednesday 2023, Power BI edition! If this is your first time joining us, we’re happy you’re here. The goal of this initiative is to help you build your Power BI skills. We provide the data and the instructions, and you build the visuals! We hope you have fun and learn a new

2023 Week 01 | Power BI: Use DAX to control visual display Read More »