

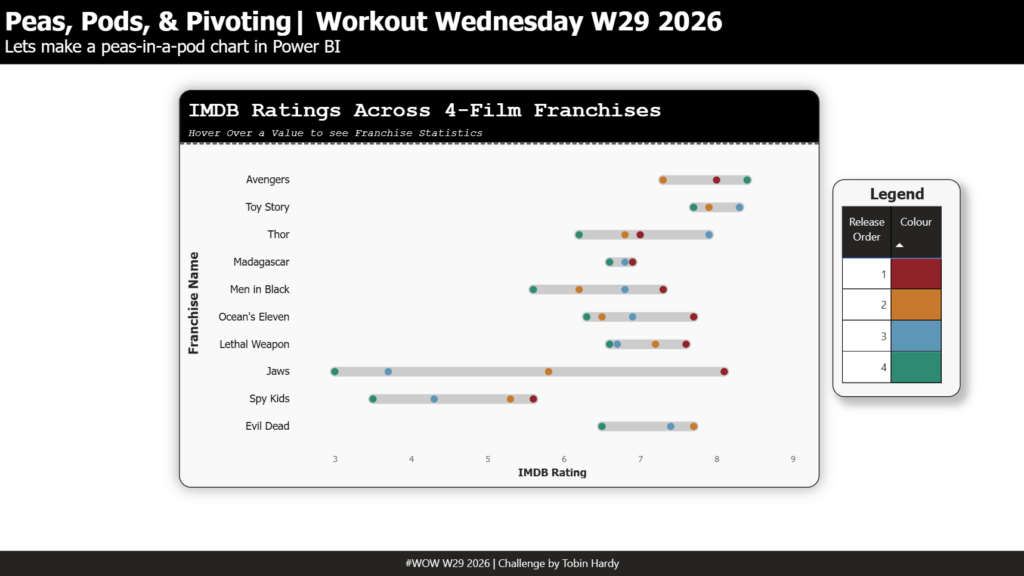
2026 Week 29 | Power BI: Peas, Pods, & Pivoting
Introduction One of the first “unique” chart types I ever learnt to visualise in a BI tool has since become one of my favourites, the Peas-in-a-Pod chart. This chart can be a great way to visualise the change between multiple data points. For example, in this challenge, we will be exploring how the IMDB ratings […]
2026 Week 29 | Power BI: Peas, Pods, & Pivoting Read More »
Power BI, Workout Wednesday