Author name: Kerry Kolosko

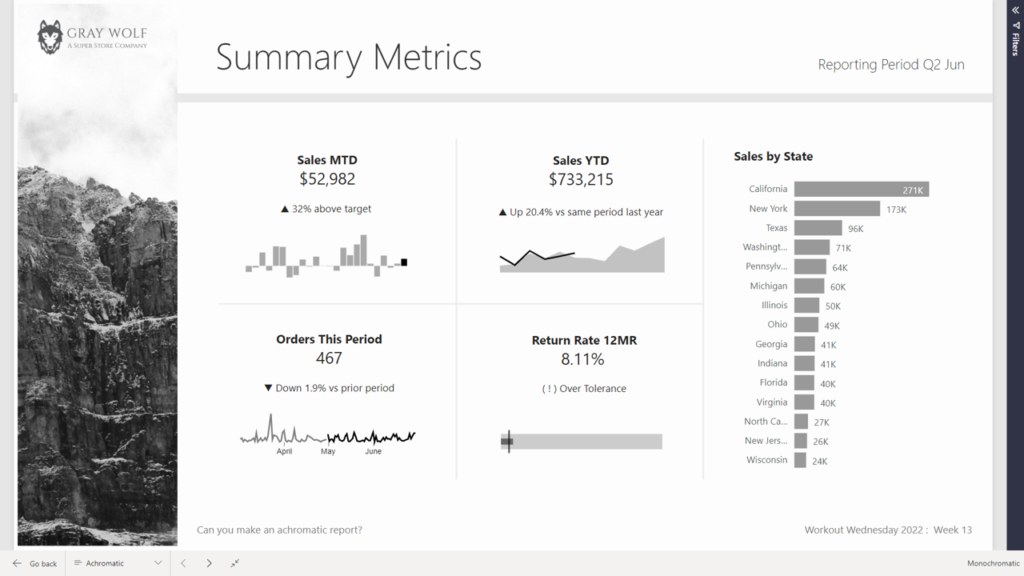
2022 Week 14 | Power BI: Create an achromatic report

Introduction April is colour month for Power BI Workout Wednesday 2022. First up we are going to try our hand at creating reports WITHOUT hue. Using a file from a previous challenge, can you create an achromatic report that uses contrast and lightness effectively? There will be some creative freedom involved in this challenge, no […]

2022 Week 14 | Power BI: Create an achromatic report Read More »

Power BI, Workout Wednesday
2022 Week 08 | Power BI: Can you make a Gantt Chart?

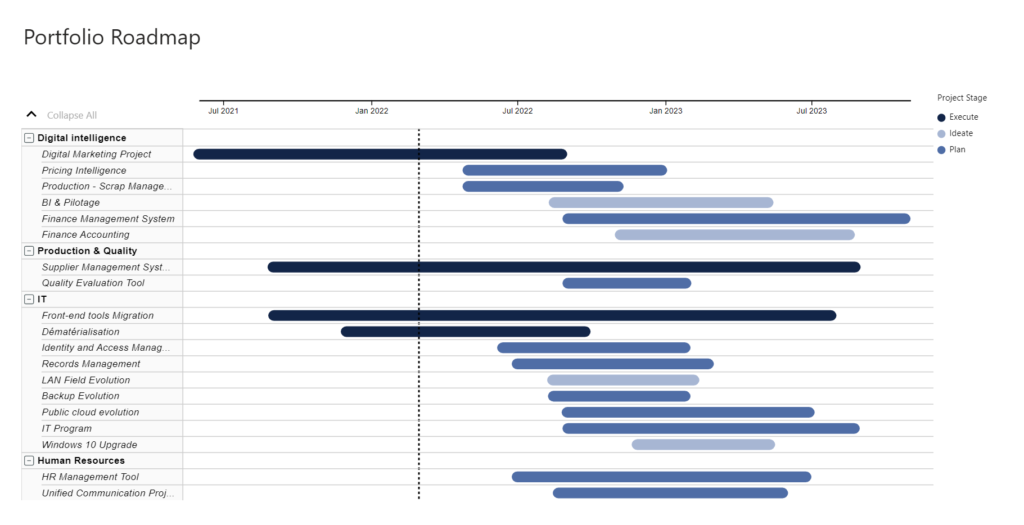
Introduction This week we are creating Gantt Charts in Power BI. It is not required to do all 4 variations, choose one of the options that interests you the most. Each option increases in time and/or experience level. Requirements QUICK MODE Import data Import the Microsoft Gantt Chart from AppSource Place Project Category in the

2022 Week 08 | Power BI: Can you make a Gantt Chart? Read More »

Power BI, Workout Wednesday
Week 05 2022 Challenge

2022 Week 05 | Power BI: Can you make a Nested Chart with Charticulator?

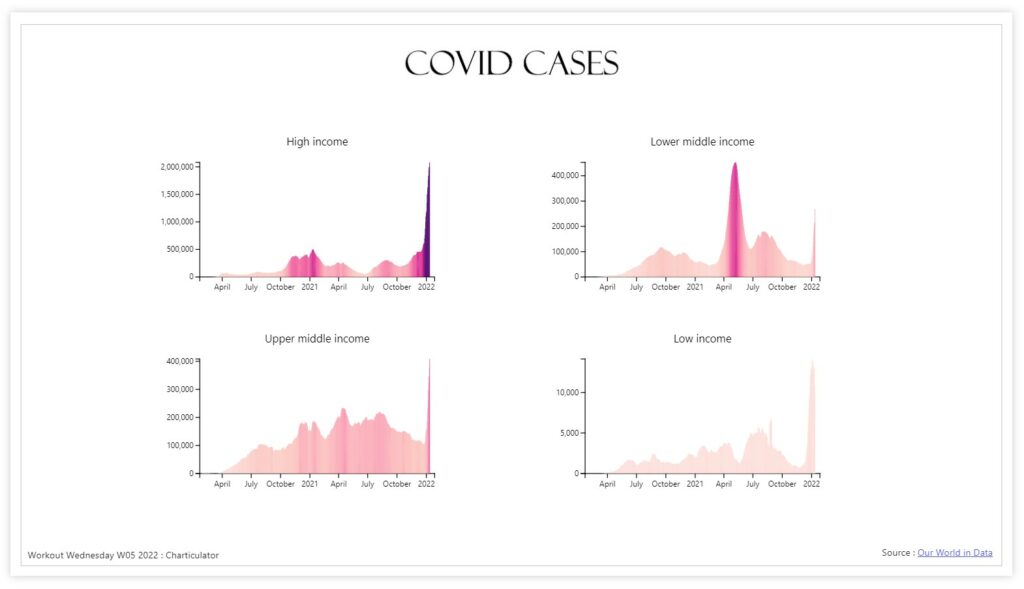
Introduction This week we are familiarising ourselves with Charticulator and Nested Charts. This graph was inspired by Gus Wezerek and Sara Chodosh’s chart for NYT Opinion. Requirements Download the data and remove all columns excepting the Date field, New Cases Smoothed Field and Location (save as csv) Create a second csv with only Location =

2022 Week 05 | Power BI: Can you make a Nested Chart with Charticulator? Read More »

Power BI, Workout Wednesday
Workout Wednesday Power BI Week 34 2021

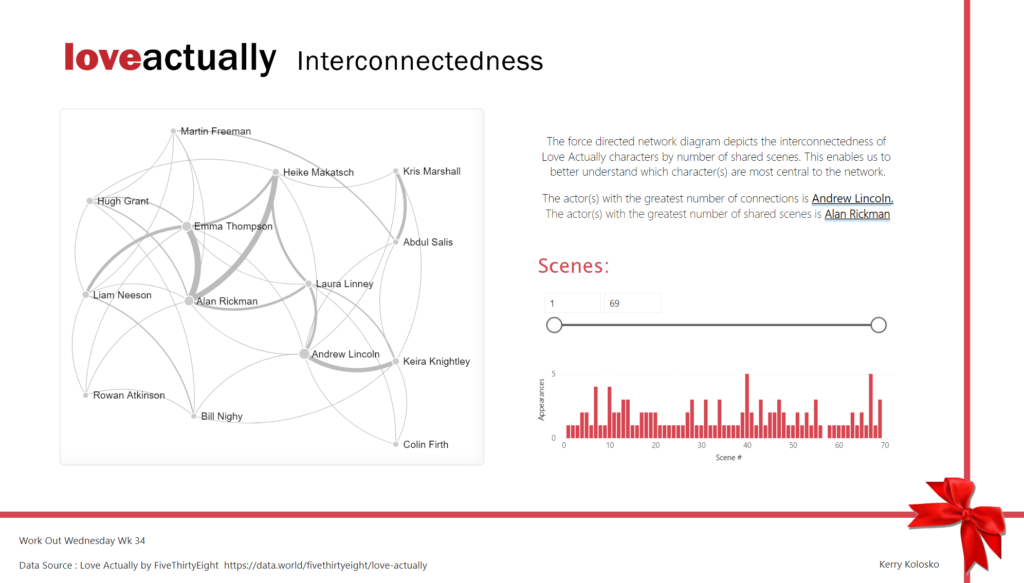
2021 Week 34 | Power BI: Building a Network Diagram

Introduction This week’s Workout Wednesday we will be creating a network diagram in Power BI.  Network diagrams are useful to explore relational datasets and are often used to visualize such things as project interdependencies, and social networks.  For this challenge we will be visualizing the interconnections of actors/characters of the Love Actually movie by number

2021 Week 34 | Power BI: Building a Network Diagram Read More »

Power BI, Workout Wednesday