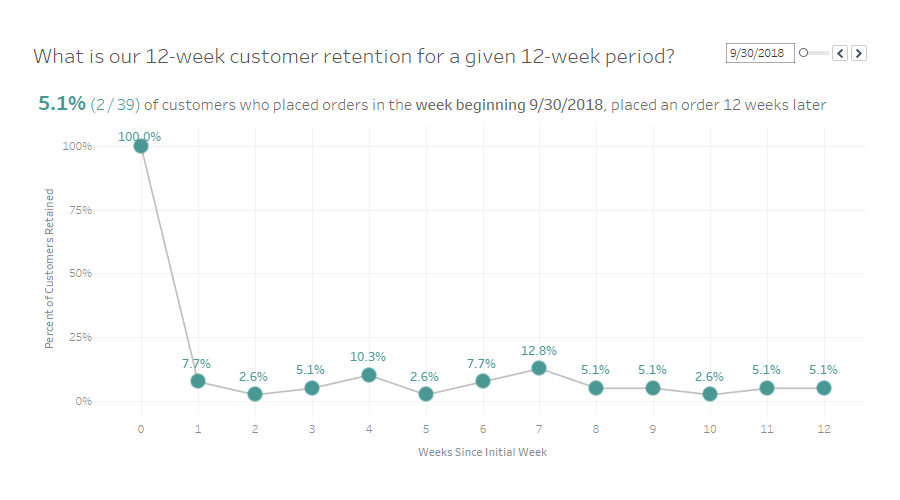
Author name: Curtis Harris

2019 Week 8: What percentage of products make up 80% of sales?

For this week’s workout, we look at one of my favorite chart types, the pareto. I love the pareto chart as a data exploration resource, and also as a powerful analytic resource. If you aren’t familiar with the pareto, the purpose is to see what % of x, makes up what % of y, with

2019 Week 8: What percentage of products make up 80% of sales? Read More »

Tableau, Workout Wednesday

Week 12: Sub-Category Sales Change in the Last Two Periods

Luke is out for the next month so this week 2016 IronViz Champion Curtis Harris is filling in. Here is Curtis’s post: I’ve heard this question many times in my career after presenting a completed viz to a stakeholder at work, “That’s fantastic, but compared to what?” So even if it is not directly requested,

Week 12: Sub-Category Sales Change in the Last Two Periods Read More »

Tableau, Workout Wednesday