Last week we were putting together a deck for an executive team and we wanted to show the seasonality of data while still showing the overall average. In our time crunch we came up with our challenge for this week!p
Challenge – Intermediate

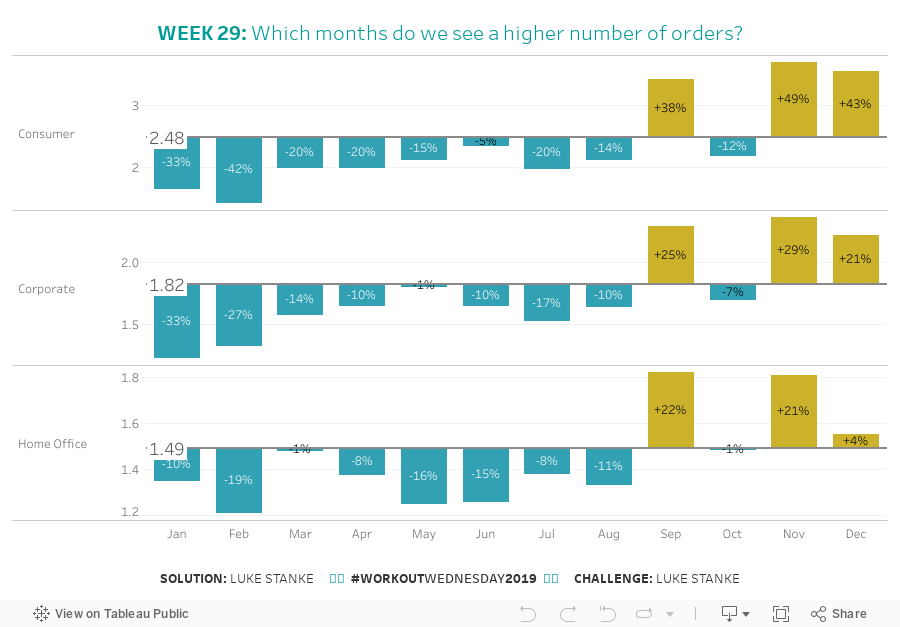
Click image to view on Tableau Public
Requirements – Intermediate
- Format: 900px by 600px
- Create a line that shows the total orders per day by segment. Show the value on the left side of the line.
- For each month, show a bar above or below the line with the orders per day for that month.
- Label the bars with the percent difference between the monthly value and the overall value.
- Match tooltips.
- Color choices are up to you.
Dataset
This week uses the superstore dataset for Tableau 2019.1. You can get it here at data.world
Share
After you finish your workout, share on Twitter using the hashtag #WorkoutWednesday2019 and tag @AnnUJackson, @LukeStanke, @lorna_eden, and @curtisharris_!
Track your progress
Also, don’t forget to track your progress using this Workout Wednesday form.
Attribute
When you publish your solution on Tableau Public make sure to take the time and include a link to the original inspiration.

Solution
[accordion tag=h6 usebuttons=true title=Watch the Solution] [embedyt] https://www.youtube.com/watch?v=QPvGFlNhS2g&w=65%&rel=0&showinfo=0 [/embedyt] [/accordion]