
Introduction
Hello friends! You may know from Tableau side but I’m so excited to be hosting my first SIGMA challenge! I’ve been playing in Sigma for the past 3 years and have continually been impressed with every release. I really like the flexibility.
I wanted my first challenge to showcase a use case that sets Sigma apart in the market by allowing the entire business workflow happen in one screen.
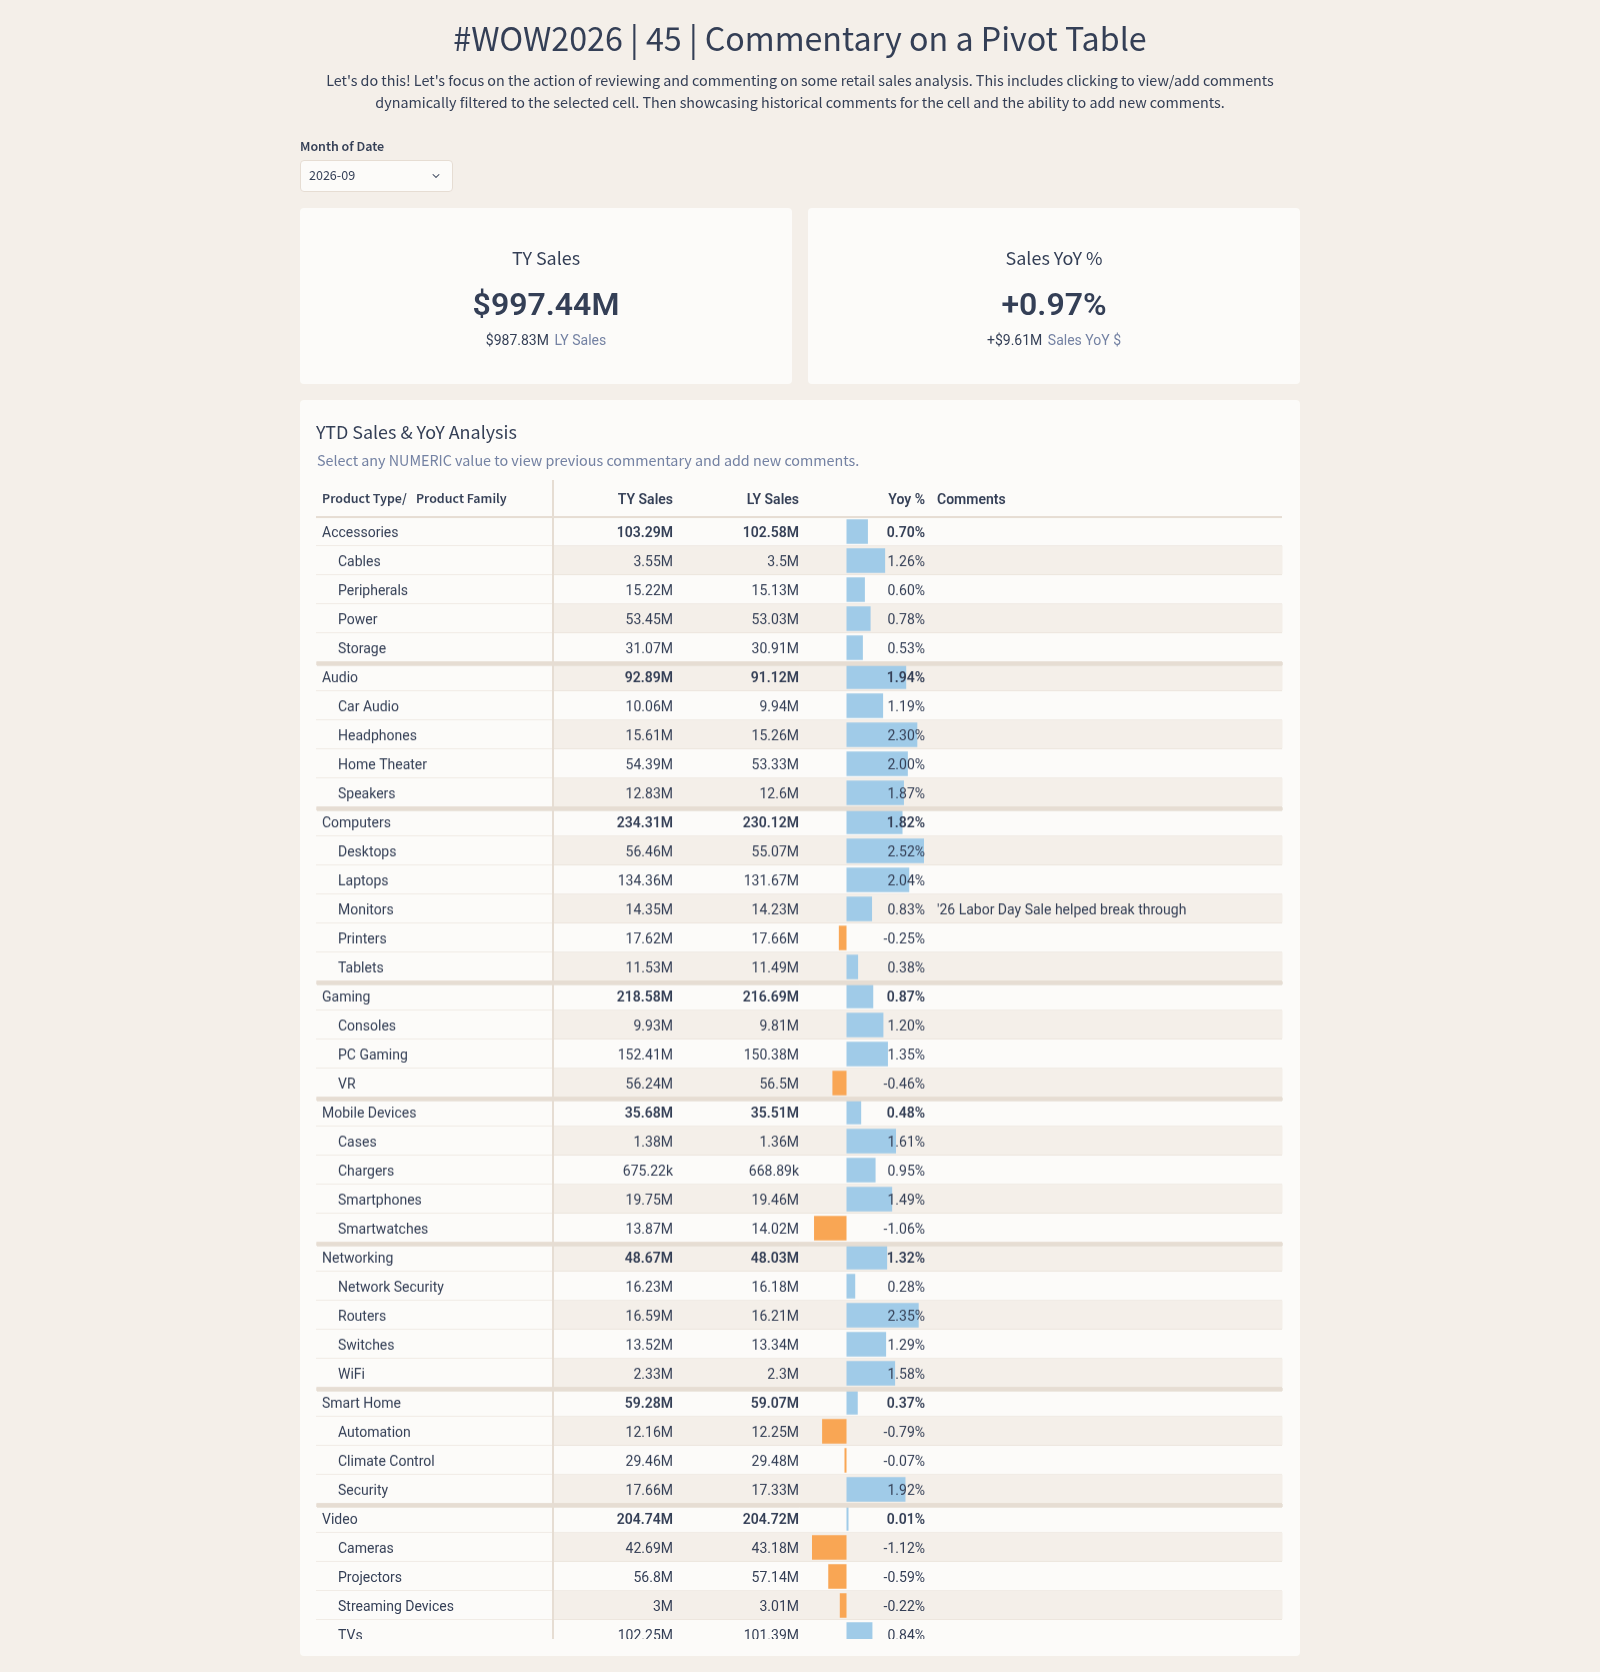
Using BIG_BUYS_POS, we’ll let users instantly slice and dice performance by type, family, and month, making year-over-year comparisons.
The real magic happens under the hood. there’s an embedded commentary workflow with a input table and historical comment log, giving the team a place to add context, capture observations, and build a running narrative around what’s happening in the business.
The end result is a tool that feels like a familiar spreadsheet to the person using it. that’s the whole idea
Requirements
- A pivot showing TY/LY YTD sales and YoY % for each Product Type & Family.
- Allow users to view and create comments for each family
- A drawer showing selected cell commentary history and new comment entry form
Dataset
Sigma Sample Database > Retail > BIG_BUYS > BIG_BUYS_POS
Attribute
When you publish your solution on Sigma Public make sure to take the time and include a link to the original inspiration. Also include the hashtag #WOW2026 in your description to make it searchable!