
Introduction
As I have begun experimenting with AI tools and data visualization possibilities, I’m finding how important it is to have a good, solid prompt of what you’re looking for and what you want things to do. I believe much of that knowledge comes from our general practice of visualization techniques but also years of integrating stakeholder feedback.
I reminded myself what some of those “little things” are when I looked back at my very first Workout Wednesday challenge. Things like making sure only complete weeks show up when filtering by date, then adjusting a weekly chart to start on whatever weekday is the first date of the filter. Showing daily grain if fewer than 30 days are selected, and weekly otherwise. So I decided to revisit this first challenge, with a few of those nuances, plus a chance to experiment with transparent tooltips in a chart that could use the extra visibility.
Requirements
- Dashboard size: 1000 x 700
- Because of the time I created the data set, “Today” = 11/7/2026
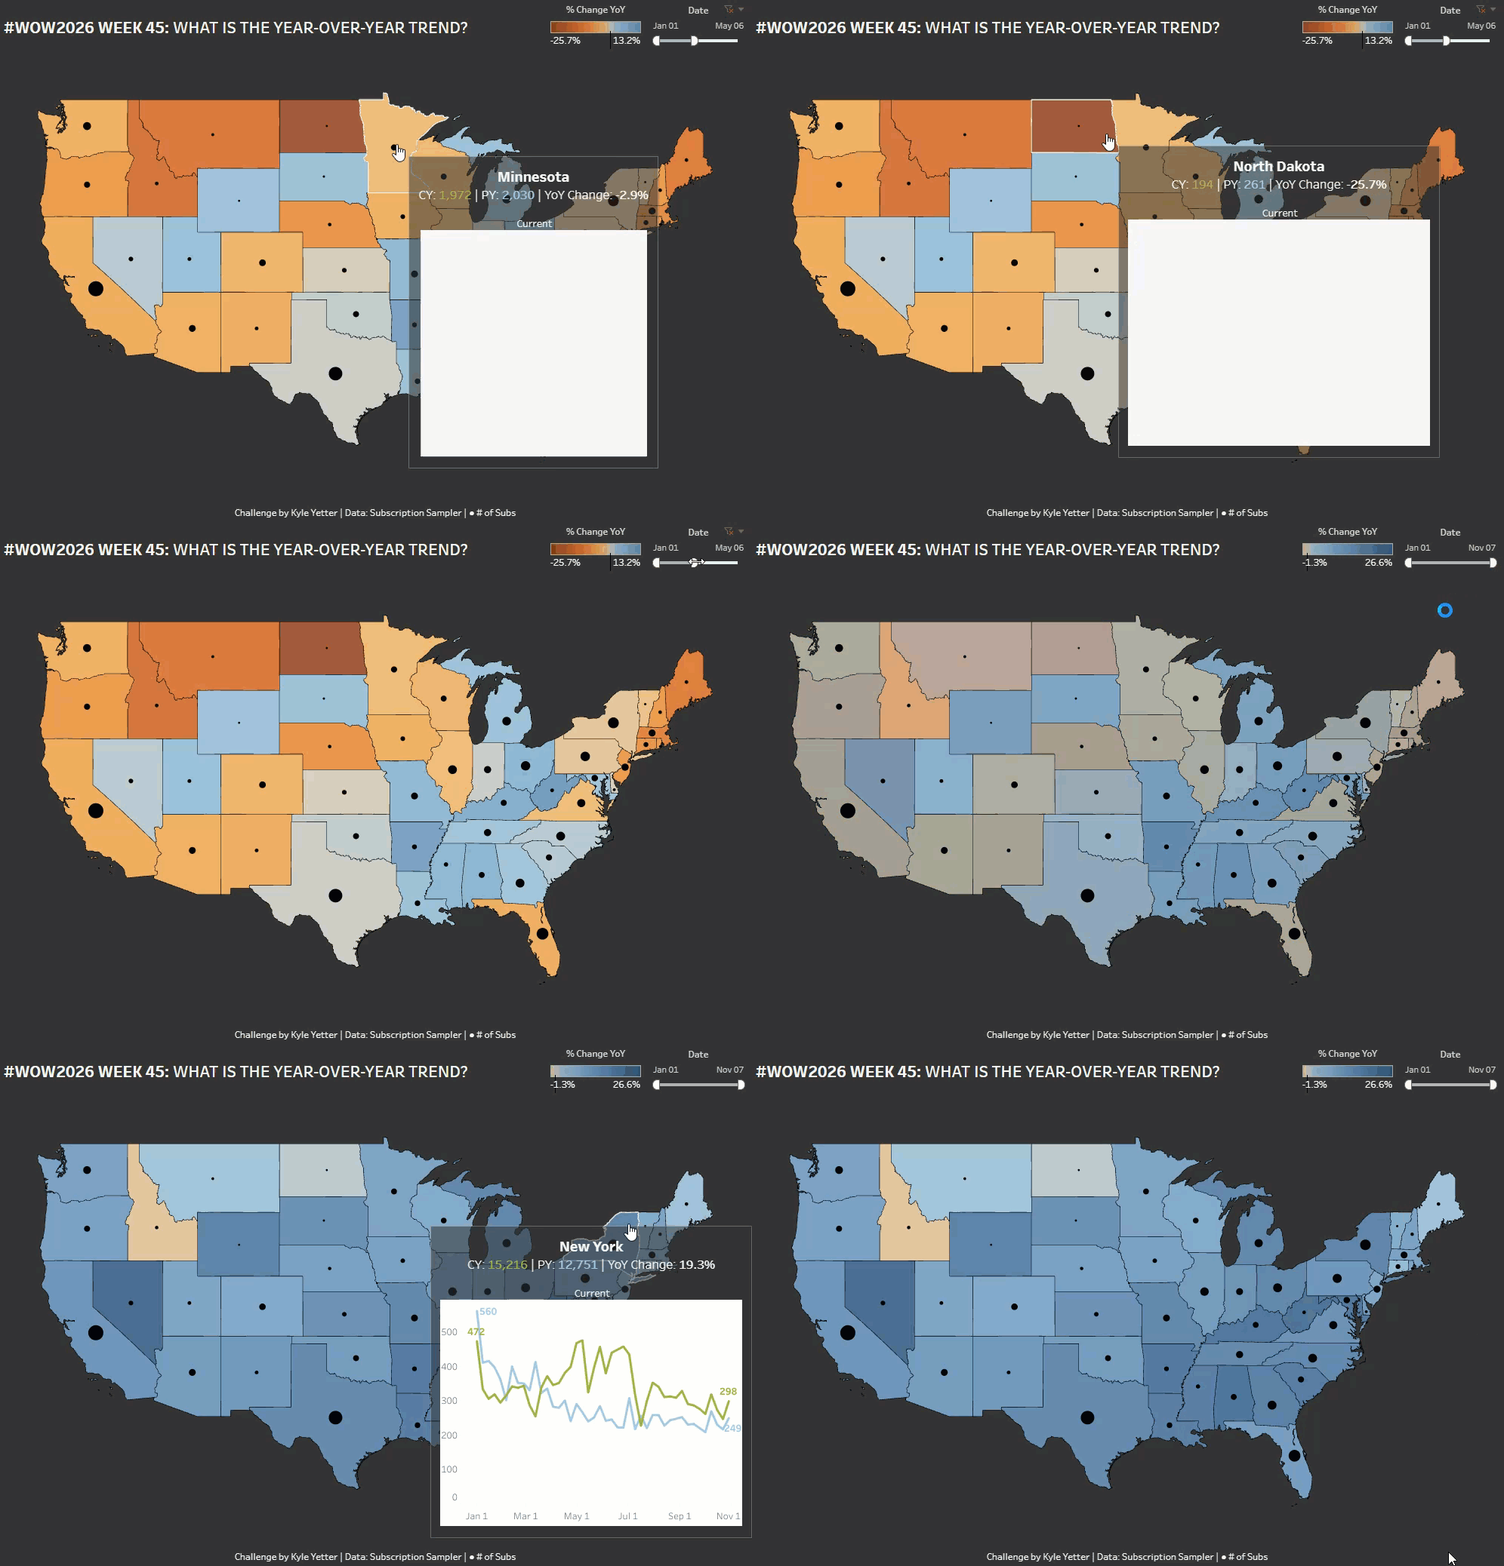
- Make a filled map with color based on the % change YoY of subscriptions
- Add a circle sized by the number of current year subscriptions
- Add a date filter that applies to the view, and make it so you can’t select any date past today
- Create a Viz in Tooltip that shows current and prior year subscriptions over time for the date filter selection, but on the same portion of the axis (one on top of the other rather than one after the other)
- The tooltip chart should show a daily grain if the date filter selection is less than 30 days, or a weekly grain if more than 30 days, and include a label identifying the date grain
- If a weekly grain, the tooltip chart should start on the weekday of the first date filter selection. It should also show only complete weeks.
- For example, if I select a date range of April 1 – June 1, the tooltip chart should have weekly data points for Apr 1, Apr 8, Apr 15, and so on through May 20 (since May 27-Jun 1 is an incomplete week).
- If a weekly grain, the tooltip chart should start on the weekday of the first date filter selection. It should also show only complete weeks.
- Add labels to the line ends of the tooltip chart
- Match tooltips, with YoY % change for the filled map tooltip, and % of total subs for the circle tooltip
- Try out transparent tooltips…doesn’t quite work with viz in tooltip, but still has an effect
- Match legends
Dataset
Available from here.
Attribute
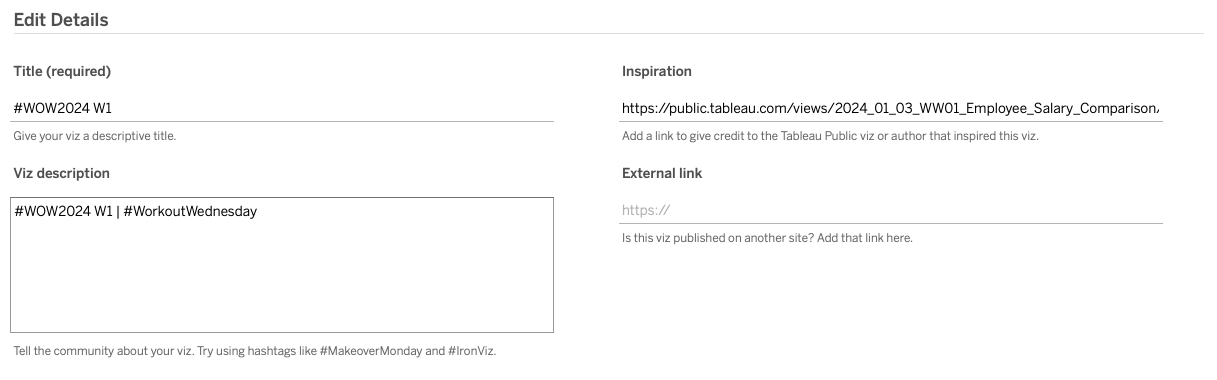
When you publish your solution on Tableau Public make sure to take the time and include a link to the original inspiration. Also include the hashtag #WOW2026 in your description to make it searchable!
Share
After you finish your workout, share on Twitter and/or LinkedIn using the hashtag #WOW2026 #Tableau and tag @WorkoutWednsday
Solution
Interactive
