
Introduction
With Sigma’s recent announcement that it’s increased its burst limit from 500 to 20,000, I’ve been bursting with joy! I think this is such an amazing feature that Sigma makes extremely easy to set up (with some workouts, of course), so I’d like to also give you a glimpse into one of the Public Beta features, Downloading with Bursting.
Need access to Sigma?
Note: You will only have view access to WOW Workbooks, Folders, and Workspaces, not edit access. Please create your WOW Workbooks under “My Documents.” We suggest creating a folder to organize all your workbooks.
Requirements
body { font-family: Arial, Helvetica, sans-serif; line-height: 1.6; color: #222; max-width: 800px; margin: 40px auto; padding: 0 20px; } h1 { border-bottom: 2px solid #444; padding-bottom: 8px; } ol > li { margin-top: 18px; font-size: 1.1em; } ul ul { margin-top: 6px; } code { background: #f3f3f3; padding: 2px 6px; border-radius: 4px; font-family: Consolas, “Courier New”, monospace; }
Bursting a Report
- Get your data
- Use the PLUGS_ELECTRONICS_HANDS_ON_LAB_DATA table at Connections > Sample Database > RETAIL > PLUGS_ELECTRONICS_HANDS_ON_LAB_DATA.
- Create the “Is Before Previous Month End?” column
- Add a column to the table with the formula:
[Date] < EndOfMonth(DateAdd("month", -1, Today()))
- Create the store name filter
- Add a filter page.
- Add a Store Name filter and target it to the source data, PLUGS_ELECTRONICS_HANDS_ON_LAB_DATA.
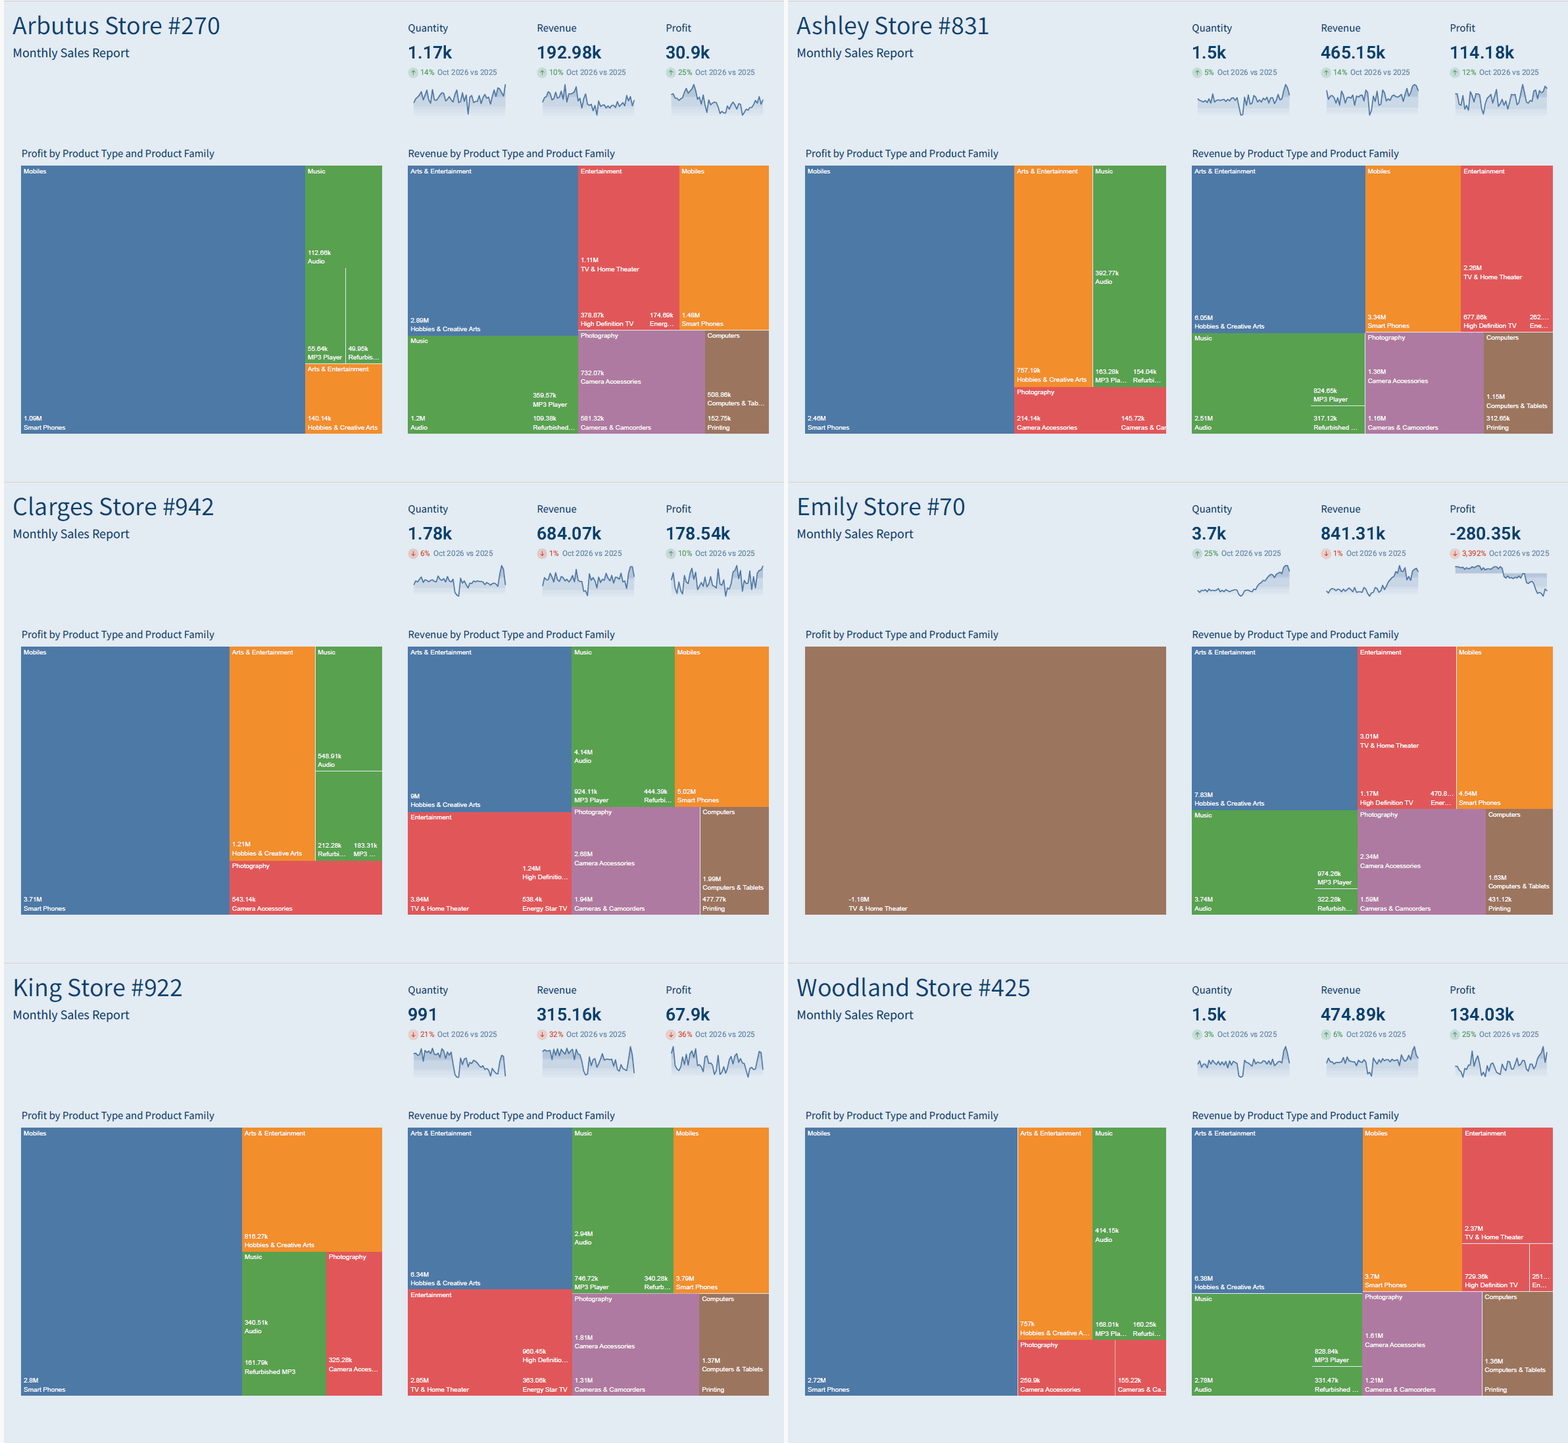
- Create the report header
- Create a new report.
- At the top left, add a dynamic text field that pulls the store name from the PLUGS_ELECTRONICS_HANDS_ON_LAB_DATA table.
- Below it, add a text field with the title “Monthly Sales Report.”
- Build the year-over-year KPIs
- Create three KPIs: Quantity, Revenue, and Profit.
- For each KPI, put the respective metric in the Value area.
- Under Timeline, put the Date field and set the comparison to Period: This Month Last Year.
- Build the Profit by Product Type and Family tree map
- Create a tree map chart.
- Set Value to Profit.
- Set Category to Product Type.
- Set Split by to Product Family.
- Set Label to Profit so the metric displays inside the tree map.
- Build the Revenue by Product Type and Family tree map
- Create a second tree map chart.
- Set Value to Revenue.
- Set Category to Product Type.
- Set Split by to Product Family.
- Set Label to Revenue.
- Publish and export the report
- Publish your changes.
- Right-click the workbook, then click the Report tab and choose Export.
- Split the export by the Store Name control.
- Select PDF and landscape orientation, then send.
- The PDFs are delivered to your email as a zip file. Each PDF is named with the workbook name followed by the store name.
Dataset
Connections > Sample Database > RETAIL > PLUGS_ELECTRONICS_HANDS_ON_LAB_DATA.
Share
After you finish your workout, share on LinkedIn, Sigma’s Community page, (or Twitter) using the hashtags #WOW2026 and #SigmaComputing, and tag Ashley Bennett, Eric Heidbreder, Stanley Gai, and Carter Voekel!
Create an interactive, sharable version of your solution here.
Also, make sure to fill out the Submission Tracker so that we can count you as a participant this week to track our participation throughout the year.
Solution
Coming Soon!