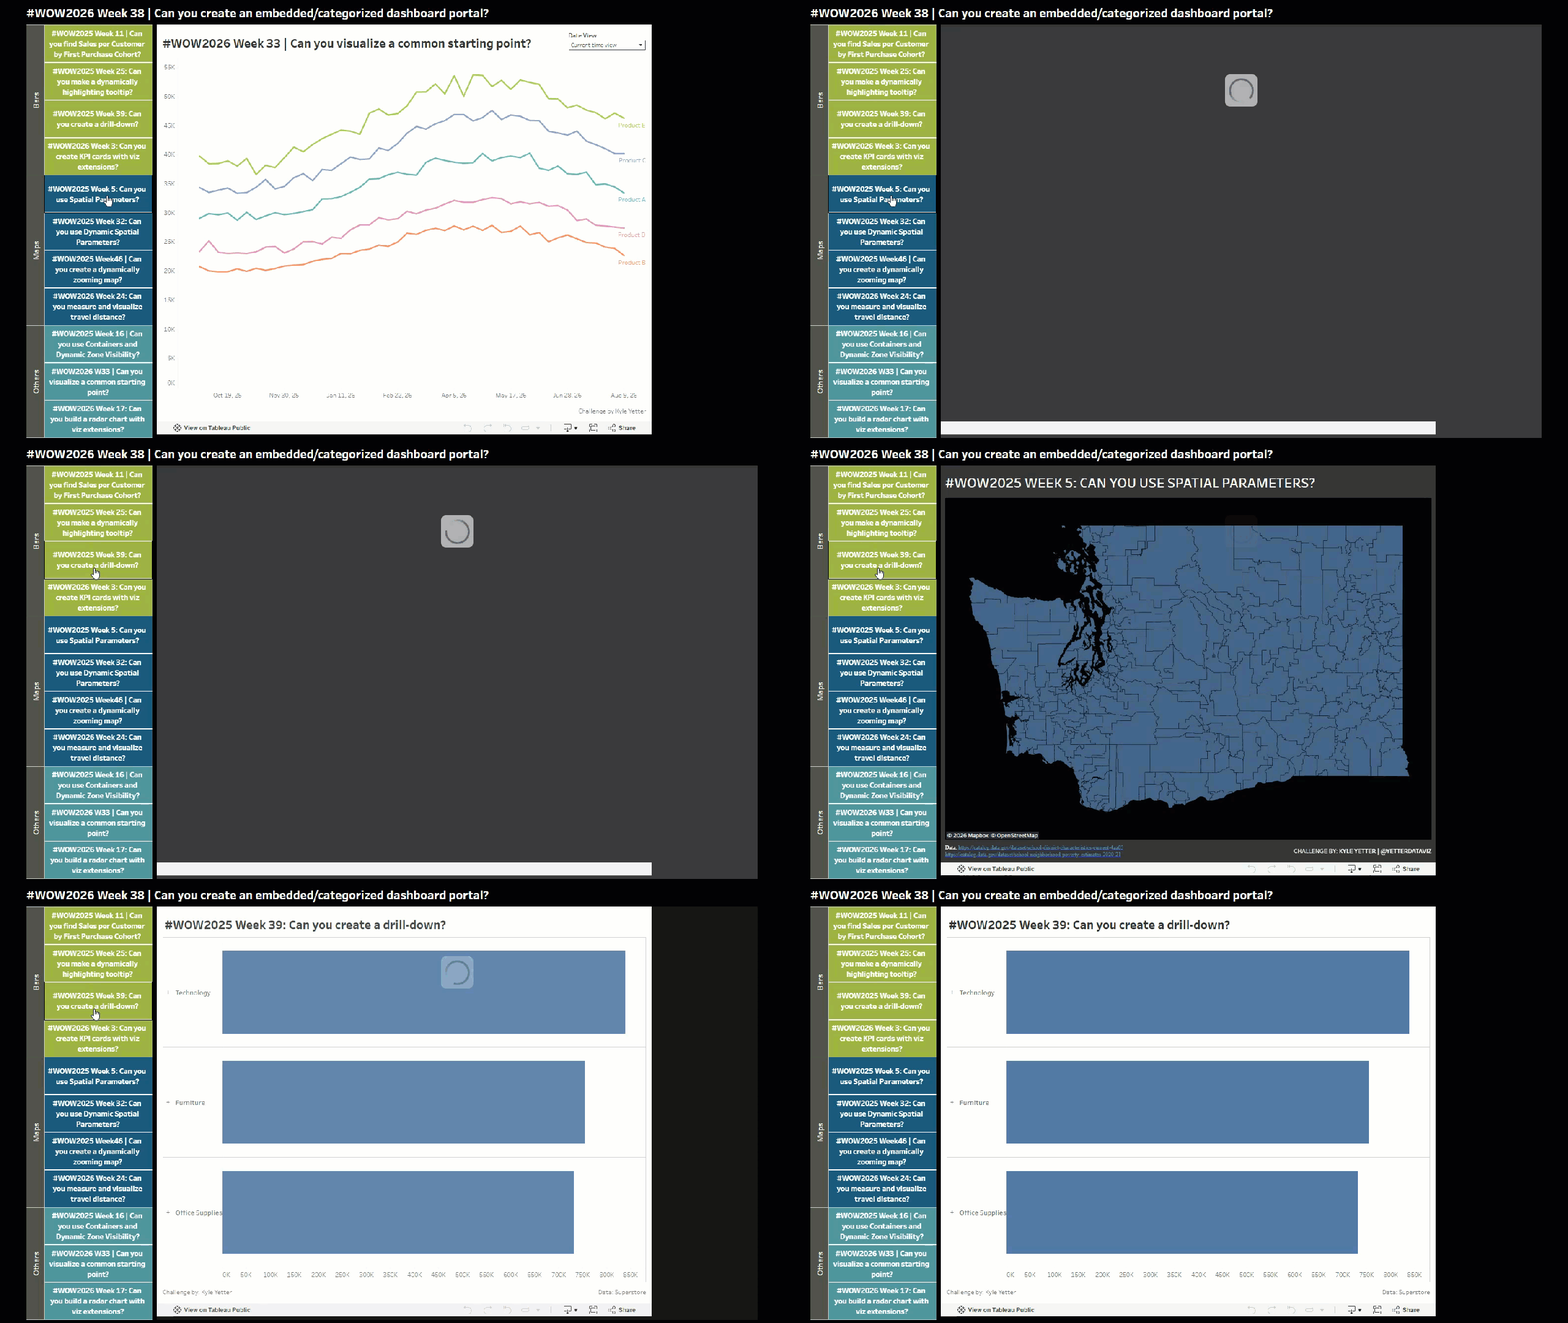
Sometimes stakeholders just want one place to go to find all the dashboards you’ve developed for them. There are ways to do this via organization or Collections in Tableau Server/Cloud, but you can also use tags and the Admin Insights data source (or Server Postgres data) to build a portal of sorts for your team to access. That’s what we’ll build this week. Since we don’t have access to a Server/Cloud instance, I’ve made a small dataset of my WoW challenges for 2025-26. I just categorized them into Bars, Maps, and Others as an example. If I were putting this on Server/Cloud, my tags would be more subject matter area focused, rather than chart types.
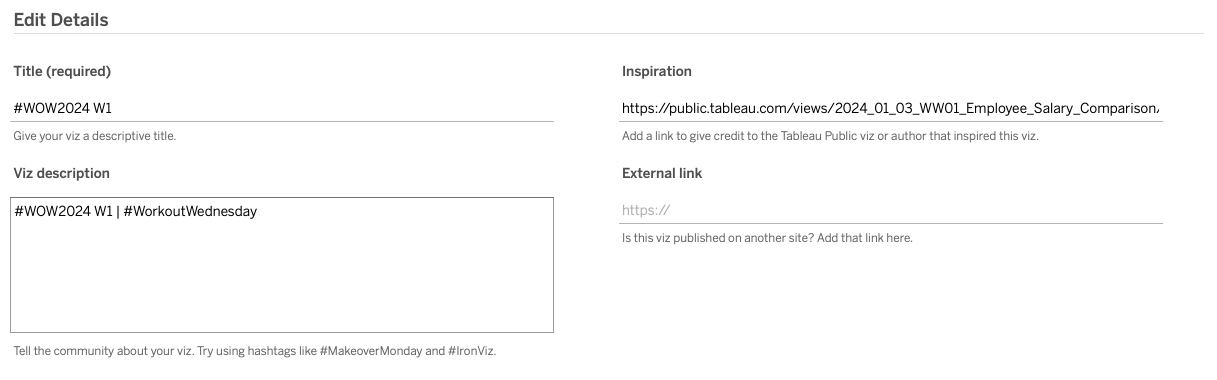
When you publish your solution on Tableau Public make sure to take the time and include a link to the original inspiration. Also include the hashtag #WOW2026 in your description to make it searchable!