Sorry for the late post.
I’m filling in this week at the last minute. Here is this weeks workout.

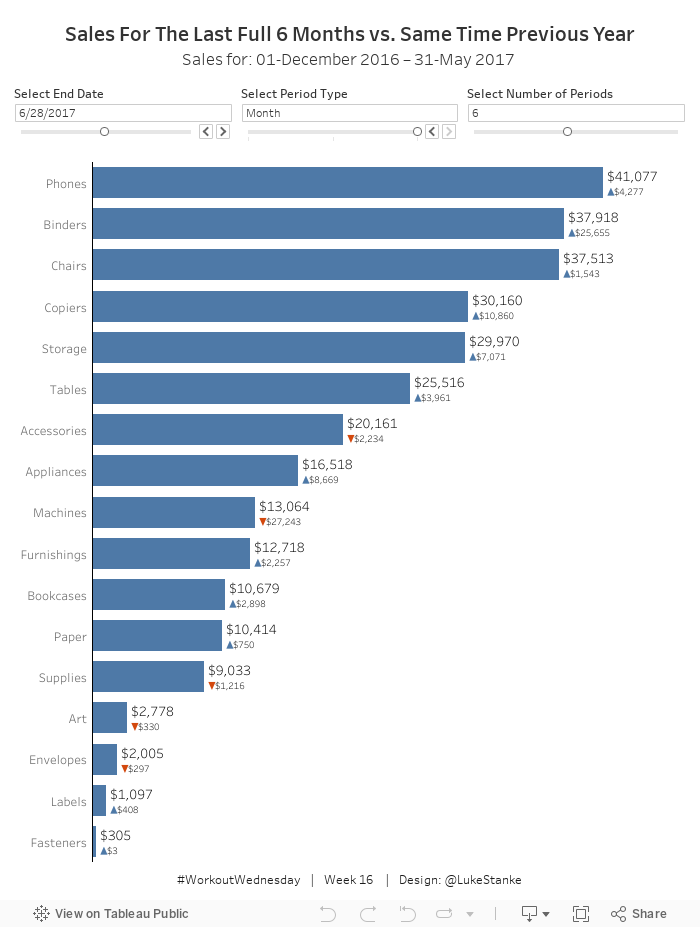
- Dashboard size is 700 x 600; tiled; 1 sheet
- Use a date parameter to select a select end date, limit it to all days in 2017.
- Use a parameter to select the period type – limit it to day, week, and month.
- Use a parameter to select the number of periods to go back – limit it from 1 to 12.
- The bars show the total sales for the last complete period. This means if 5/12/2017, month, and 1 is selected you will see sales from 4/1/2017 thru 4/30/17.
- Add sales for the same period to label.
- Compare this to sales over the same period from 2016.
- Add a blue arrow up if sales are up compared to 2016.
- Add a red arrow down if sales are down compared to 2016.
- Show the difference in sales over these time periods. Make sure to show no negative signs. The arrows will indicate the change.
Dataset
This week uses the superstore dataset. You can get it here at data.world
Share
After you finish your workout, share on Twitter using the hashtag #WorkoutWednesday and tag @AnnUJackson, @LukeStanke, and @RodyZakovich. (Tag @VizWizBI too – he would REALLY love to see your work!)
Track your progress
Also, don’t forget to track your progress using this Workout Wednesday form.