#WOW2022 Week 31: Let’s build a KPI dashboard

Introduction

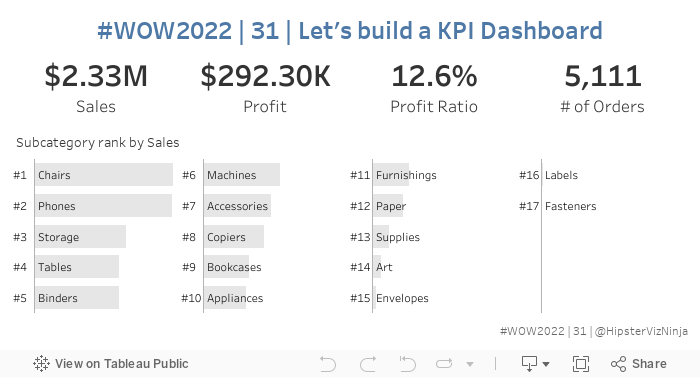
Who doesn’t love a good KPI dashbaord? This one is fairly simple and straightforward. Let’s look at four simple metrics and see how each subcategory ranks within a selected metric.

With this challenge – MIND THE NUMBER FORMATTING 🙂

Requirements

  • Dashboard Size: 700 x 350
  • 2 sheets
  • Display the following KPI metrics
    • Sales
    • Profit
    • Profit Ratio
    • # of Orders
  • Show the relative rank for subcategories
    • WATCH THE NUMBER FORMATTING IN THE TOOLTIPS
  • Clicking on a metric with update the rank
  • Have a fun!

Dataset

This week uses the Superstore data set. You can find it here on Data.World

Attribute

When you publish your solution on Tableau Public make sure to take the time and include a link to the original inspiration.  Also include the hashtag #WOW2022 in your description to make it searchable!

Share

After you finish your workout, share on Twitter using the hashtag #WOW2022 and tag @LukeStanke, @_Lorna_Brown, @HipsterVizNinja, @_hughej, and @YetterDataViz

Solution

Interactive

Scroll to Top