Introduction
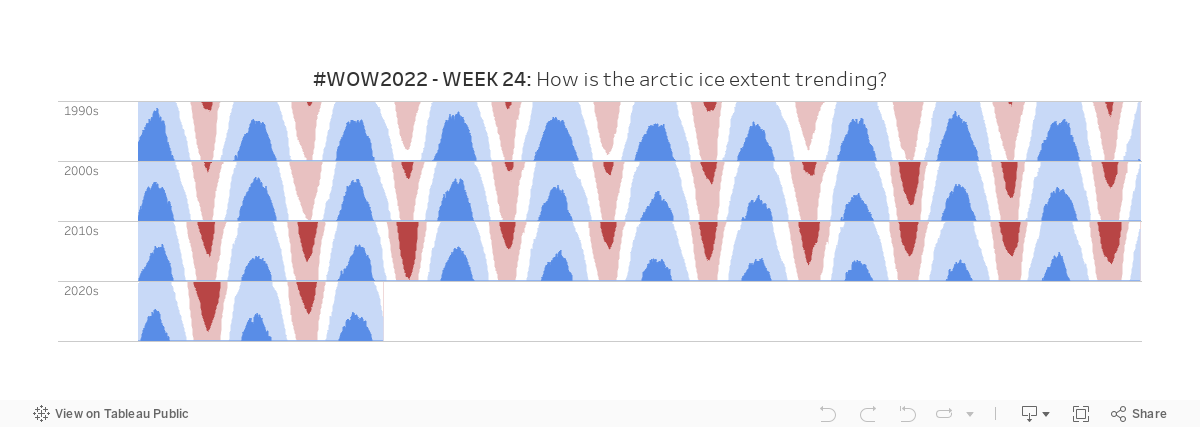
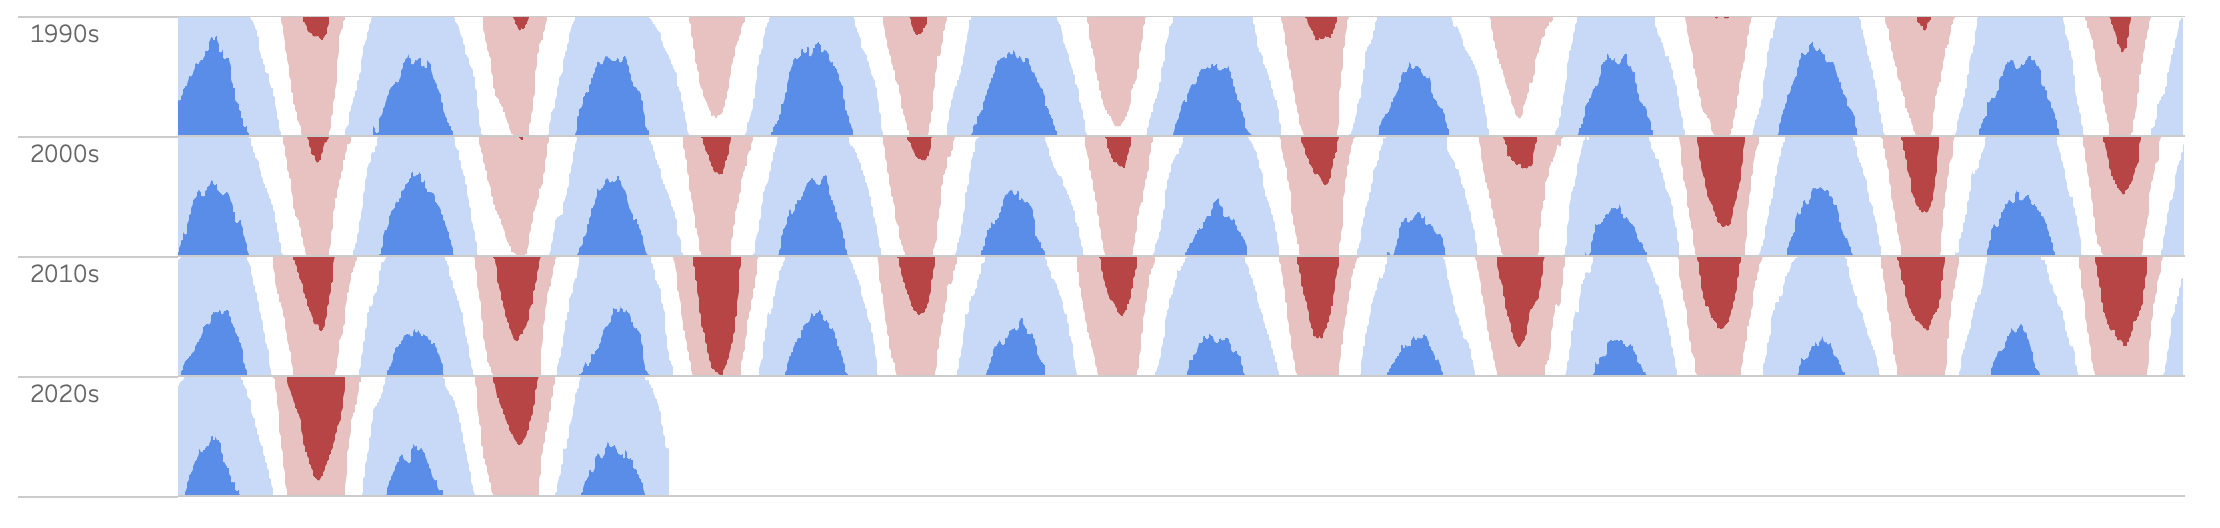
This week you are invited to build a horizon chart of the arctic ice extent–the amount of ice on the arctic ice cap. Data comes from the National Snow and Ice Data Center.
In case you are not familiar with the horizon chart, a nice definition can be found here on Nathan Yao’s Flowing Data, and a great example from a Tableau Zen Master Joe Mako can be found here.
This chart is useful for tracking the trends in ice coverage over time. By comparing it over decade you are able to quickly see changes in ice coverage.
Requirements
- Dashboard Size: 1200px by 400 px
- 1 of Sheet
- Normalize the arctic ice (NH) to run between 0 and the maximum ice extent.
- Build a horizon chart that shows values 5 levels (0 to 0.2, 0.2 to 0.4, 0.4 to 0.6, 0.6 to 0.8, 0.8 to 1.0
- #B84545
- #E8C1C1
- #FFFFFF
- #C8D9F7
- #598DE7
- Partition the data by decade
- Show only the 1980s through today
- On the x-axis show data by day of decade
- Match the formatting of the horizon chart
Dataset
Download this Extract that we’ve created from the National Snow and Ice Data Center.
Attribute
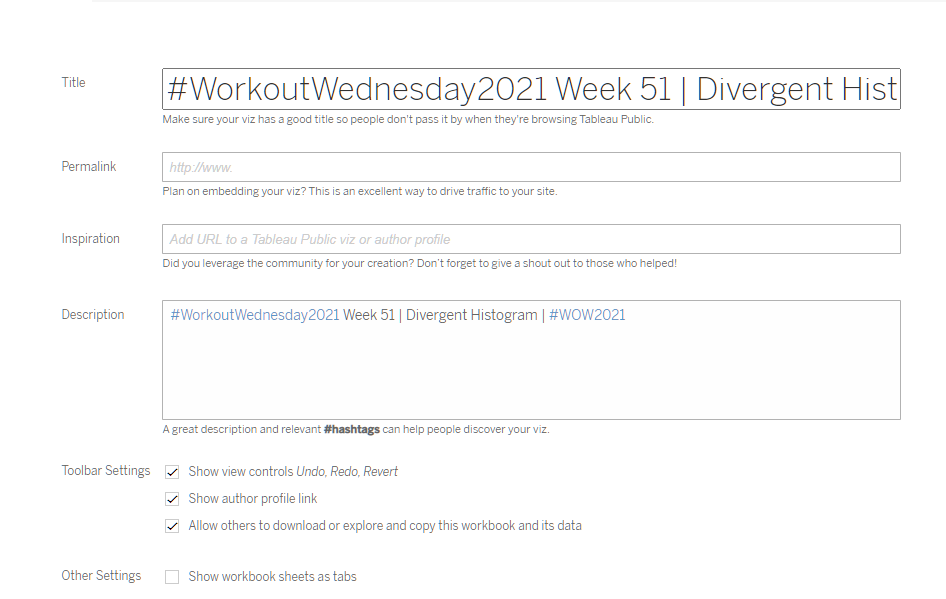
When you publish your solution on Tableau Public make sure to take the time and include a link to the original inspiration. Also include the hashtag #WOW2022 in your description to make it searchable!
Share
After you finish your workout, share on Twitter using the hashtag #WOW2021 and tag @LukeStanke, @_Lorna_Brown, @_hughej, @YetterDataViz and @HipsterVizNinja
Solution